


1. INTRODUCTION
While high-income countries have struggled against obesity epidemic, countries at lower end of SDI (socialdemographic index) levels witnessed a significant increase childhood obesity [1]. Notably in Vietnam, 2014-2015 surveillance of the National Institute of Nutrition showed nearly one in two urban children were obese [2]. Once a child becomes overweight or obese, he or she is more likely to maintain this condition to adulthood [3, 4]. Furthermore, this condition may lead to chronic diseases for these children when they grow up [5-7]. Currently, health professionals most depend on BMI to diagnose this condition although concerns have been raised about this index’s validity [8, 9]. Hence, other alternatives have been developed. Until now, the use of adiposity for diagnosing childhood obesity is increasingly endorsed by contemporary literature [8-12].
DXA is becoming a reference method to measure body fat [13]. However, due to logistic and financial limitations, technical complexity and concerns for radiation, it is not feasible to use DXA widely and routinely on the field. Therefore, scores of equations using anthropometric characteristics were developed to estimate body fat percentage because of the usefulness of these measures in various settings, especially at the primary care level. In children, they include famous equations developed by Slaughter or Goran [14, 15]. These predictive equations were built upon specific populations and need validating on other populations before being used. So far, to our best knowledge, little or no previous studies have confirmed the validity of these equations on Vietnamese children.
The present study primarily aimed to validate current predictive equations against DXA on children from 6 to 17 years of age currently living in Ho Chi Minh city. The secondary aim was to describe the anthropometric characteristics of the same population.
2. MATERIALS AND METHOD
This cross-sectional study recruited 144 children of normal health (72 boys and 72 girls) aged 6 – 17. They were conveniently sampled from 5 schools (2 elementary, 2 secondary and 1 high school) in District 10 of Ho Chi Minh City during the 2018 – 2019 period. The eligibility criteria were children from 6 – 17 years of age, not having any acute or chronic illnesses nor using any medications which were related to the alteration in body composition.
The research team came to the schools to collect anthropometric data according to a protocol as previously described [16]. We took weight and height measurements in kg and cm, respectively, and to the closest 0.1 unit. Waist size was taken at the navel level, and hip size was measured at the largest place at the sagittal plane, both to the closest 0.1 cm. Then computed BMI was classified using 2007 WHO Child Growth Standards [17].
Trained research staff took skinfold thickness (SFT) at 6 sites on the right body parts (triceps, subscapular, abdominal, supra-iliac, mid-thigh, and medial calf) with Harpenden Calliper (Baty International, England) to the closest 0.2 mm. We took two measures at each site, and if the two readings differed by more than 0.5 cm, recorded the third with the same method.
Furthermore, the maturational level was first rated in a medical room by peadiatricians from Children’s Hospital 1 using Tanner staging. After that, the children were grouped into prepubescent, pubescent and postpubescent based on WHO recommendation [18].
The Slaughter equations, which include ones for Triceps and Calf (Tri+Calf), ones for Triceps and Subscapular (Tri+SS) in white and black, were employed to predict BF% [14]. As for Goran equation, because it produces fat mass in kilogram, we calculated BF% by dividing predicted fat mass by weight [15].
DXA whole-body scanning was taken to measure BF% (Hologic Discovery QDR system) at the Department of Diagnostic Imaging at 115 People’s Hospital. Scans were performed and analysed by musculoskeletal physicians from 115 People’s hospital, according to hospital standard protocol.
We used the software Stata 14.2 (StataCorp LLC) to analyse the data. Unpair t-test was performed to compared continuous data between two genders. To measure the agreements between predicted and measured body fat, we plotted the Bland-Altman analysis. Pearson’s correlation was also performed to assess the change of bias across the average values of predicted and measured body fat. Correlation coefficient was categorized into no correlation, weak correlation, moderate correlation, and strong correlation as previously described [19].
3. RESULTS
Data from Table 1 show descriptive data from participants aged between 6 and 17. More than half were overweight or obese. Moreover, though boys had significantly lower body fat, more of them were obese than girls. Nearly half of the children were in post-puberty.
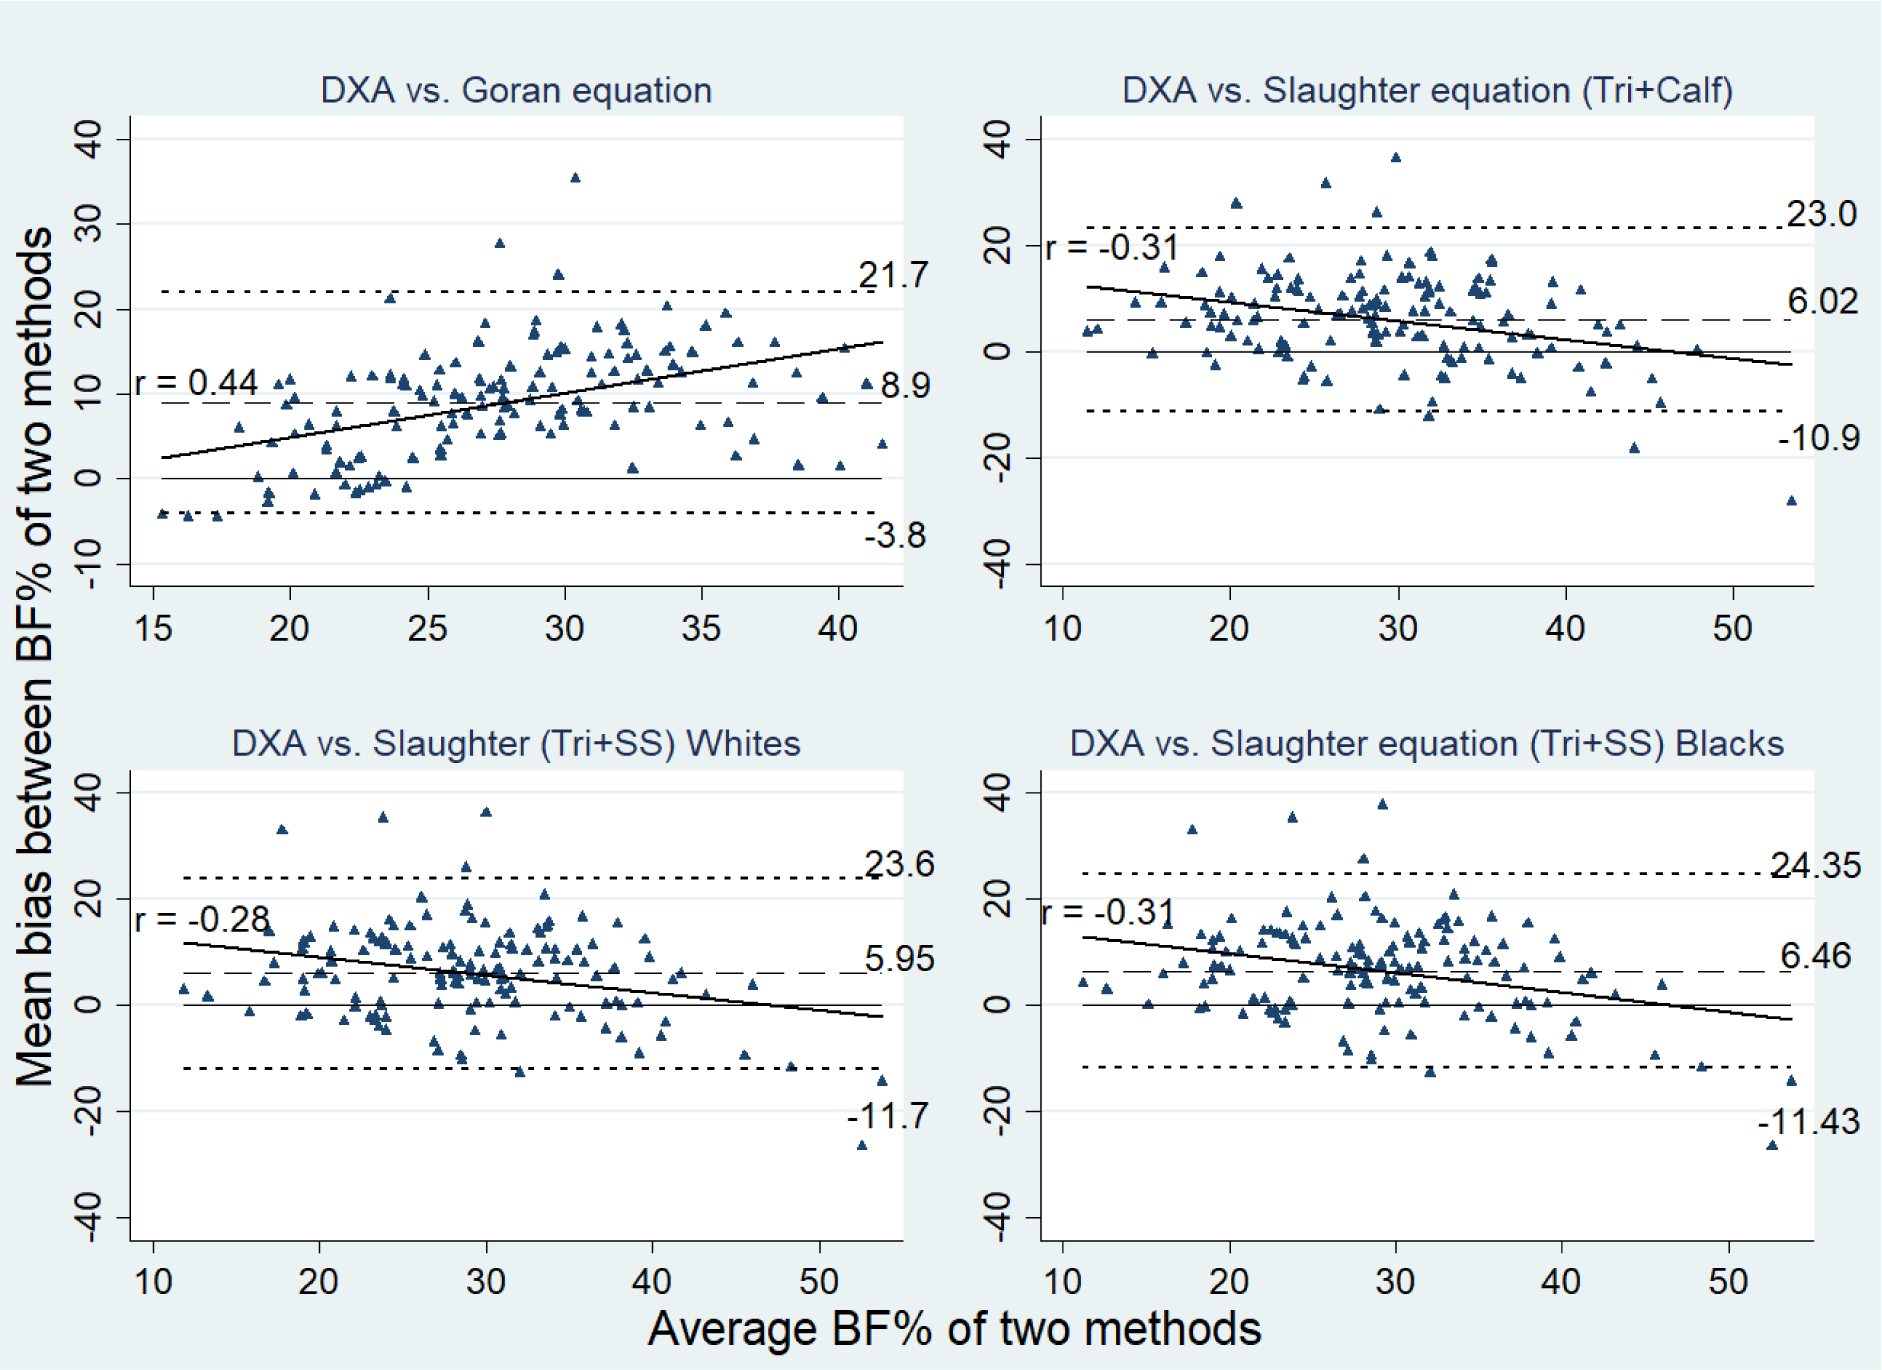
In Table 2, the significant biases between the two methods show that the four SFT equations underestimated the reference BF%. The 95% LOAs were wide with the gap fluctuating from 25.50% (Goran’s) to 35.78% (Slaughter’s). Although the bias from Goran equations was the most pronounced, its LOAs was the narrowest. Furthermore, the correlation degree between bias and average BF% from DXA and each equation was weak to moderate, indicating the bias significantly changed across the body fat continuum (Figure 1). Specifically, as for the three Slaughter equations, the more body fat, the lower the bias. Conversely, the bias from Goran equation became larger when children had more body fat.
4. DISCUSSION
In this study, we found that Goran and three Slaughter SFT equations underestimated the BF% measured by DXA scans. Also, the difference computed by Goran equation was larger when the child has more body fat. Conversely, with three Slaughter equations, the difference yielded was larger when a child has less body fat. Therefore, we cannot use these equations as a replacement for DXA. We also learnt that the proportion of children with overweight or obesity had gone up to 52.8%; BF% was 32.2 ± 7.6 %. As far as we can tell, this is the first study in Vietnam to validate predictive equations against DXA scans with the latest nutritional status data from children in Ho Chi Minh city.
The first finding is the underestimation of BF% by predicted equations. This could be explained by the differences in anthropometric and ethnic characteristics. Firstly, Goran used a Caucasian sample to develop his equations; Slaughter’s sample also included Caucasian and Black children [14, 15]. A study by Deurenberg et al [20] showed that Asian people might have 3– 5% higher body fat compared with Caucasian people with similar BMIs. This can be because Asian people accumulate a greater amount of abdominal fat tissue [21]. Secondly, roughly one in two children in our sample were overweight or obese, while Goran’s and Slaughter’s development samples were of the normal weight range. Hence, bias and LOAs would become wider. In other studies [22-25], the underestimation was also reported and mean biases ranged from 2.9 to 11.1%. Only Wickramasinghe et al [26] showed that Slaughter equations for white children overestimated by 5.9% ± 8.4 (mean bias ± standard deviation).
The wide LOAs and significant change of bias across the body fat continuum also described in previous studies [22-26]. These studies shared the same bias trends by Slaughter’s [22-26] and Goran’s [24, 25]. The correlation was negative between BF% bias from Slaughter equation and average BF% in children with excessive fat in Gonzalez-Ruiz’s study and type 1 diabetes children in Sarnblad’s study [22, 23]. However, in the healthy group in Samblad’s study and Wickramasinghe et al, no significant correlation was observed [23, 26].
Furthermore, the figure that 52.8% of the children were overweight or obese might imply the growing trend of overweight and obesity in urban area. In 2014, Thuy et al [27] found that the prevalence in urban secondary schools in Hanoi was 36.2%. Earlier in 2010, the figure in Phuong et al [28] were 27.5% of children from urban secondary schools in Ho Chi Minh city.
The strength of our study is that we used DXA as a reference method. This technique has high validity and reliability in measuring BF% [13]. Furthermore, the use of Bland-Altman analysis was more accurate than merely using correlation or t-test to evaluate the agreement between two methods. However, we find it hard to generalize our results because our sample was well-characterised. Five conveniently-sampled schools were adjacent to each other and located near the city centre. Also, our sample was relatively small and could not be representative of children of Ho Chi Minh city.
SFT equations are convenient tools to measure body composition on the field. Therefore, more and more research has been done to validate predictive equations on a specific population. Our results raise a need to develop new anthropometric equations on Vietnamese children. Also, larger-scaled studies are warranted to determine the nutrition status of children in urban and in rural schools as well.
5. CONCLUSION
We found that Slaughter and Goran equations cannot predict accurately BF% of children in Ho Chi Minh city and the development of new anthropometric equations is warranted. Moreover, with the preliminary results showing an alarming figure of over 50% of children with overweight or obese, we need a large-scale study to have a bigger view of the situation.