1. INTRODUCTION
Dengue fever is a contagious disease spread by the bite of the female Aedes mosquito, endangering human health [1]. There are around 2.5 billion people in the world live in risk areas of dengue spread, especially in Asia, the Pacific, the Americas, Africa, and the Caribbean [2]. Each year had more than 500,000 people with severe dengue are hospitalized, and about 2.5% of the affected patients die, mostly in children (report of the World Health Organization) [3]. There are no specific medications to treat a dengue infection, and there is no effective vaccine against dengue [3]. The current prevention of dengue mainly affects to the transmission vector [3].
The main mosquito vectors for dengue, Aedes aegypti, and Aedes albopictus are sensitive to the weather. Various evidence suggests that weather factor such as temperature [4-11], temperature amplitude [12], rainfall [5, 7, 10, 13], relative humidity [7, 8, 10, 11, 14-16], and wind speed [17-22] have a significant correlation with dengue infection rates. At present, the prediction model using weather factors for dengue pre-epidemic can be an effective tool for preventive medicine to prepare and control the disease. There have been many successful studies in developing and applying this model in practice [4, 5, 8, 23, 24]. However, each geographic region has different weather conditions, so it is impossible to use the same model everywhere. These models' statistical complexity is the barrier to local public health use in preparedness and control dengue outbreaks. So, converting from a complex mathematical model to a simple, understandable scoring scheme and usable by practitioners and authorities helps apply the predictive model into practice.
Ho Chi Minh city has the highest number of reported dengue fever cases in the Southern region of Vietnam [25]. Dengue fever incidence rate is increasing in Vietnam, from 120 per 100 000 population in 2009 (105 370 cases) to 194 per 100 000 population in 2017 (184 000 cases) [26]. But now, Vietnam still has no prediction model for early predict system base on weather features. In this study, we conducted following steps: (i) to evalue the correlation between weather factors and dengue cases; (ii) to develop a model for forecasting dengue cases based on relevant weather factors, and (iii) to progress a scoring scheme that is usable by public health practitioners for predicting dengue outbreaks in Ho Chi Minh city, Vietnam.
2. MATERIALS AND METHOD
This study was conducted in Ho Chi Minh city, a central city in Southern Vietnam. Located in the transitional region between the South East and the South West, Ho Chi Minh city covers an area of 2,095.06 km2. Ho Chi Minh is the most populous city in Vietnam, with a population of 8,611,100 people, a population density of 4,110 people/km2 [27]. HCMC has a tropical climate, a dry and tropical wet climate. There are two seasons: the rainy season run from May through November with an average rainfall of about 1,800 mm, and the dry season from December through April. The average temperature is 28°C with a range between 13.8 and 40.0°C. The average humidity is from 78 to 82%. The average wind speed is 3.6 m/s in the rainy season, and is 2.4 m/s in the dry season [28]. Crowded populations with favorable weather conditions for dengue spread are important causes that make Ho Chi Minh city one of the areas with dengue morbidity and mortality top of the country [29-32].
Weekly data for reported dengue cases in Ho Chi Minh city from January 1999 to December 2017 were obtained from the infectious disease surveillance system of Ho Chi Minh city Centers for Diseases Control (HCDC). According to the National Communicable Disease Control Law, physicians in hospitals and clinics must report every day diagnosed dengue case to the local health authority within 24 hours. HCDC is the lead agency responsible for obtaining and analyzing reported data for disease prevention at the city level. Dengue cases were diagnosed using the Decision No. 794/QÐ-BYT of the Ministry of Health, Viet Nam for data from 1999 to 2009 and Decision No. 3705/QÐ-BYT of the Ministry of Health, Vietnam [33] for data from 2011 to 2017.
Daily weather data from 1 January 1999 to 31 December 2017 were collected from the open-source website at https://www.ncdc.noaa.gov/ of the United States National Oceanic and Atmospheric Administration (NOAA). The weather data comprise daily minimum, maximum, and average temperatures (°F), daily average dew point (°F), daily cumulative rainfall (inches), and daily average wind speed (knots). These daily data were then converted to the mean of weekly average temperature (°C), temperature amplitude (°C), wind speed (m/s), relative humidity (%), and weekly cumulative rainfall (mm) for analyses.
The data analyses consist two parts. (1) constructing a predictive model used weekly dengue cases and weather data from 1999 to 2012. (2) validating predictive model used data from 2013-2017. The steps of each part are described below:
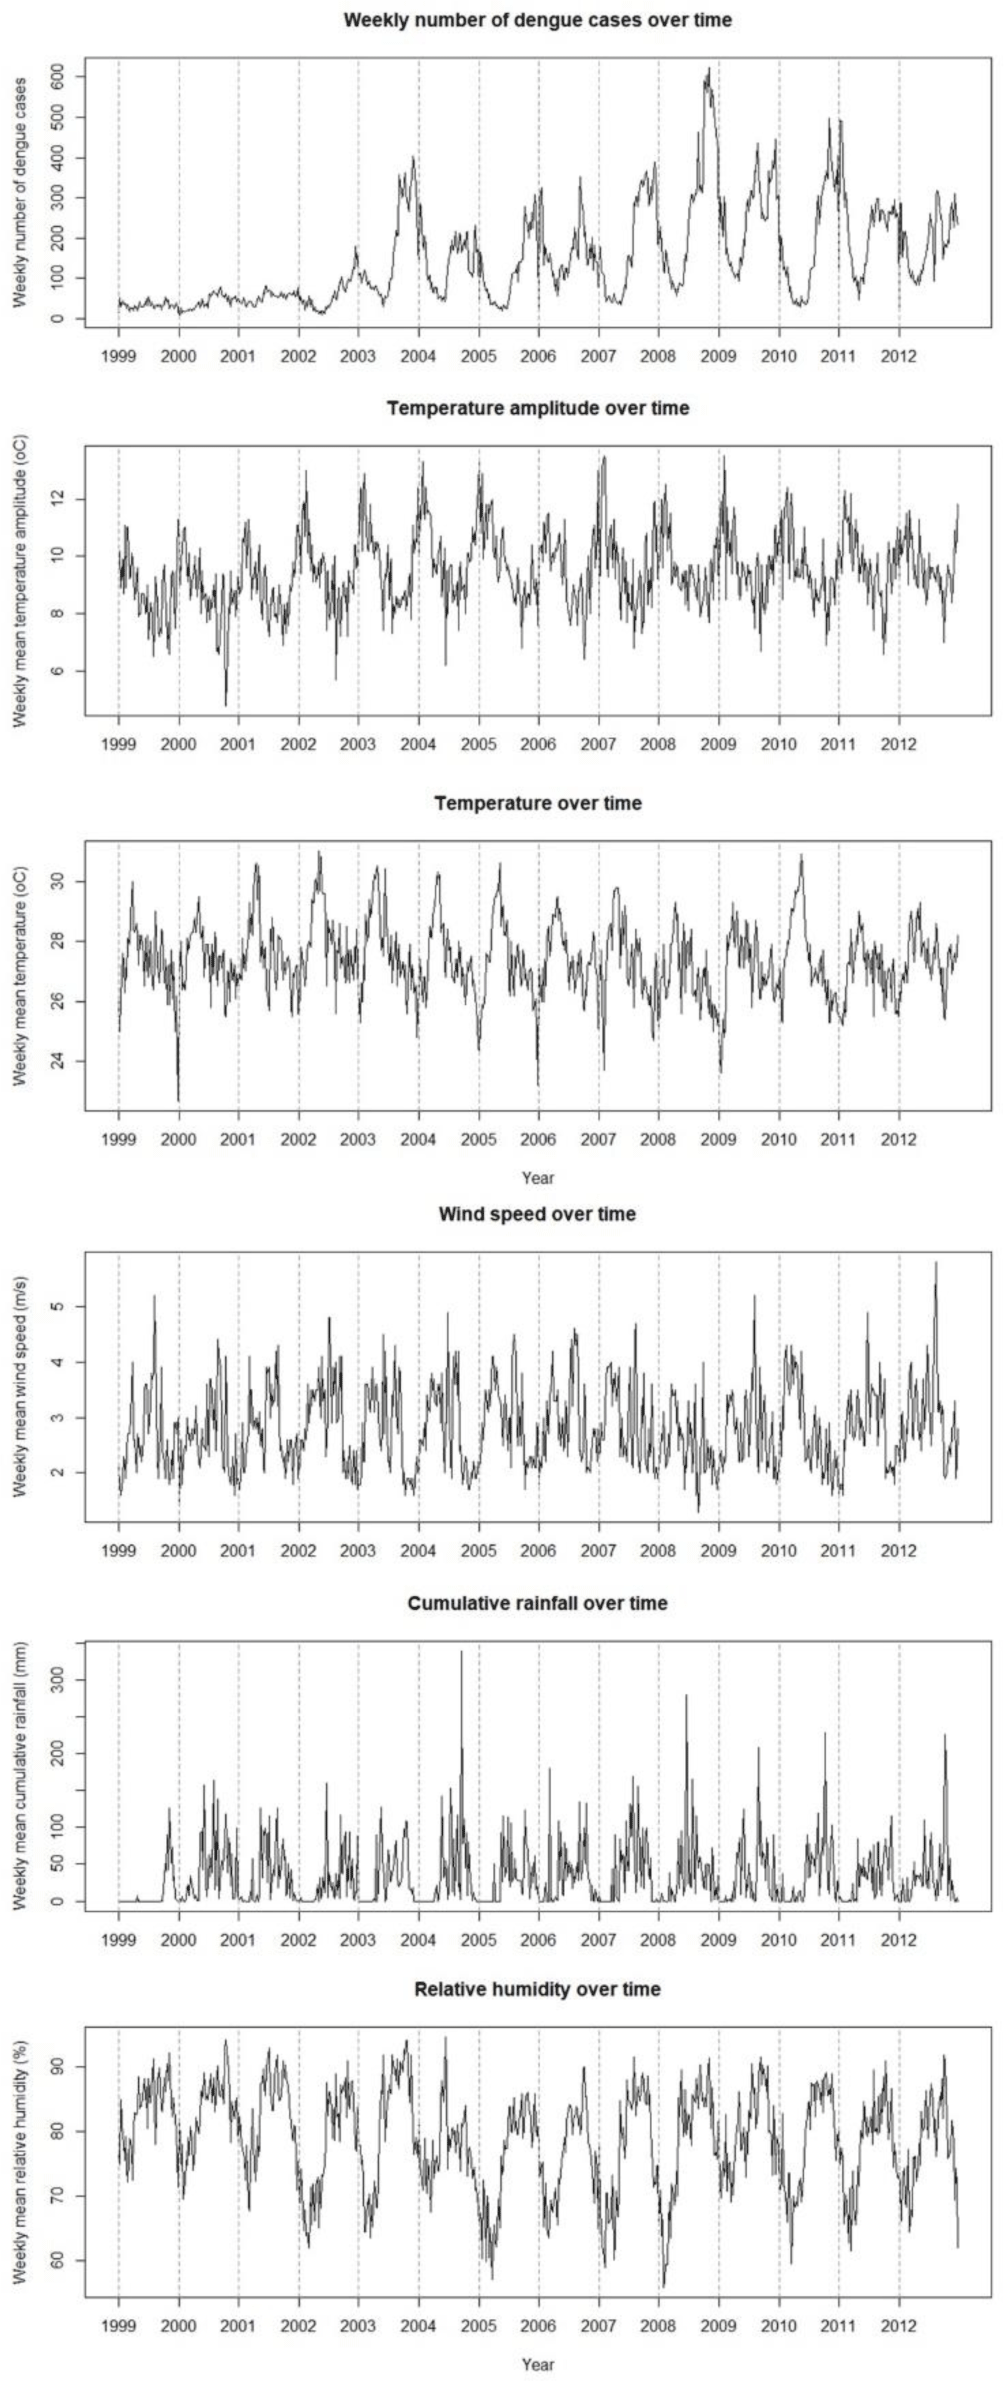
First, we used a simple table and scatter plots to describe both the exposure (temperature, temperature amplitude, wind speed, relative humidity, and cumulative rainfall) and outcome (number of dengue cases) over time for the study period.
Second, we used the cumulative lags of weather factors which were summed up from lags correspondent for intervals of 4 weeks: lag 1 – 4, 5 – 8, and 9 – 12 weeks as the predictors. This study used a quasi-poisson to determine the association between weather factors with dengue incidence at different lag times. To capture long-time and seasonal trends in the data, we generated the flexible spline function with 4 degrees of freedom per year. The number of dengue cases in the current week may be affected by the number of dengue cases in the past, so the model used the number of dengue cases lag some weeks to put into the prediction model like a predictor.
In final step, the predictive factors that are statistically significant from the second step will be normalized into groups based on percentiles: <50, 50 - <75, 75 - <95, and ≥95, these groups will be correlated with the weekly number of dengue cases, while controlled the impact of population movement, long-time, and seasonal trend over time. The β-coefficients calculated from the forecasting model will then be standardized and rounded to form predicted scores. The scoring scheme prediction model will be used to predict the outbreaks to improve the usefulness of the predictive model in the prevention of the disease.
To test the predictive ability of the model, we compared the observed number of dengue cases in 2013-2017 vs. the predicted number of dengue cases from the model. We used the Mean Absolute Percentage Error (MAPE) to measure the accuracy of the predictive model. A Receiver Operating Characteristic (ROC) curve analysis was used to validate the classification ability of the scoring scheme in predicting the outbreaks. In this study, we defined an outbreak as when the number of dengue cases at one week exceeded 95th percentile of the weekly data of the number of dengue cases throughout the period from 2013 to 2017.
The number of dengue case before 2002 is too low compared to after 2002 because the data before 2002 were collected by only 3 big hospitals in Ho Chi Minh City (i.e., Hospital for Tropical Diseases; Children Hospital No.1; Children Hospital No.2). To check the robustness of the predictive model, we built two models: (1) using data from 1999-2012 for constructing a predictive model and using data from 2013-2017 for validating the model. (2) using data from 2002-2012 for constructing a predictive model and using data from 2013-2017 for validating the model. Then, the results of the two models were compared.
3. RESULTS
During the follow-up period (1999 to 2012), there were 108,210 reported dengue cases in Ho Chi Minh city, Vietnam. The weekly number of dengue cases and cumulative rainfall had a wide dispersion. The average is significantly larger than the median, showing that data had a Quasi-Poisson distribution. The average weekly count of dengue cases was 149 cases, the lowest week was 4 cases, the highest week was 622 cases. Temperature, temperature amplitude, and relative humidity were not variations much between weeks in the year. The median of the weekly average temperature was 27.3°C, the average minimum temperature was 22.7°C, and the average maximum temperature was 31°C. The weekly average temperature amplitude has a median of 9.4°C, the average minimum and maximum temperature amplitude ranged from 4.8°C to 13.5°C. The weekly average relative humidity has a median of 79.7%; the minimum and maximum values were 55.9% and 94.6%, respectively. The average wind speed was 2.8 m/s, ranging from 1.3 m/s to 5.8 m/s. The median of weekly average cumulative rainfall was 17.1 mm; the highest weekly rainfall was 228.8 mm.
The number of dengue cases had a trend towards increasing from the midyear to the end of the year, decreased from the first half of the year, and had a cyclical season each year, peak every five years.
Cumulative rainfall in Ho Chi Minh city has a difference between two seasons, the rainy season from midyear to the end of the year, the dry season is from the end of the year to the middle of the next year. Also, the rainfall reached a peak every period 3 to 5 years. The temperature was higher in the first half-year, lower in the last half-year. Amplitude temperature was higher in mid-year, lower in the remaining period, similar to relative humidity and wind. Ho Chi Minh city's weather is cyclical, with the distribution of similar data each year.
After univariate analysis to evaluate the correlation between dengue cases and weather factors, we selected all statistically significant correlations to construct a multivariable model for dengue cases in the period 1999 – 2012. The final multivariable model with 10 variables including dengue cases at lag 1-4, 5-8, and 9-12 weeks; wind speed at lag 5-8 and 9-12 weeks; temperature amplitude and humidity in only lag 5-8 weeks; rainfall at lag 1-4, 5-8, and 9-12 weeks (Table 2).
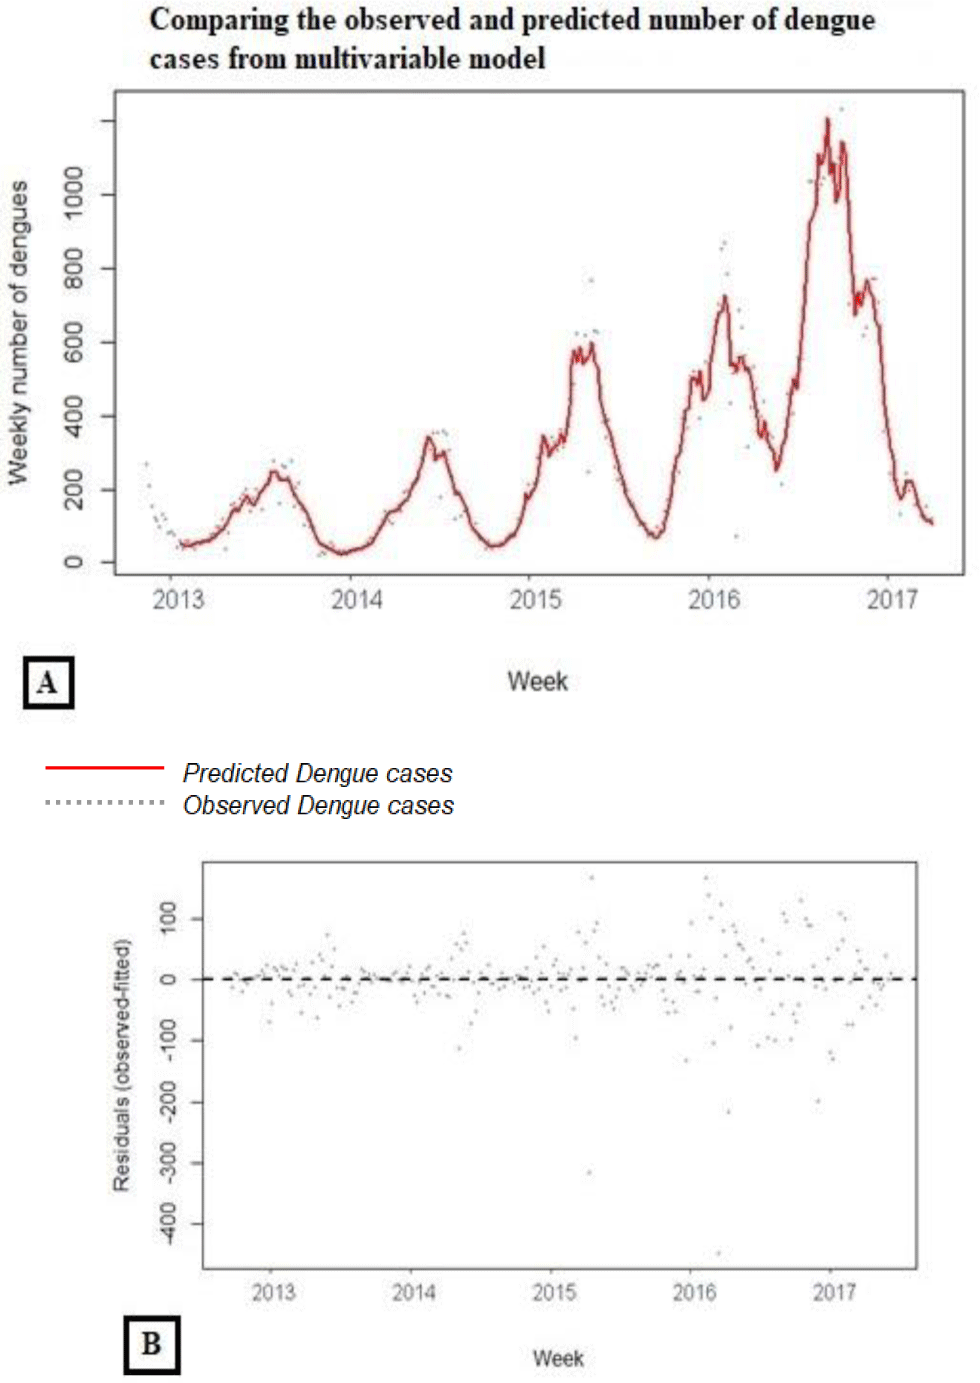
To check the model’s prediction power, we conducted re-predict and evaluated the residuals plot. A comparison of predicted and observed cases of dengue from 2013 to 2017 (Panel A, Figure 2) showed that the model predicted quite well the observed number of dengue cases. The number of cases predicted by the forecast model did not differ much from the actual number of cases. The residuals plot of the multivariable model (Panel B, Figure 2) also revealed that the residuals distributed balance, reasonably uniform and random on both sides of the zero line which indicates goodness of fit of the predictive model.


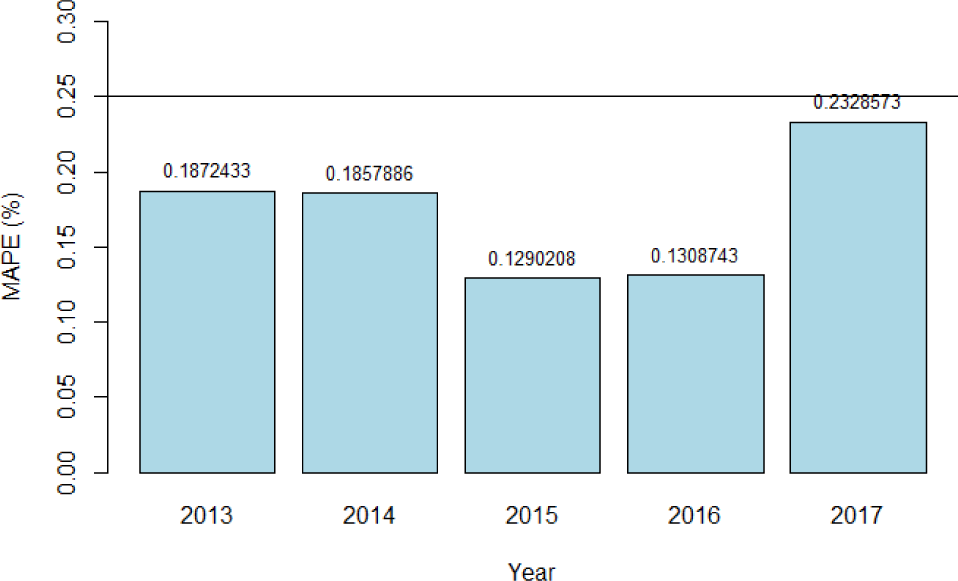
In addition, we calculated the mean absolute percentage error (MAPE) of the predictive model from 2013 to 2017 (Figure 3). The result showed that this model using climate predictors explained about 80% of the variance in dengue cases with a small value of the mean absolute percentage error (MAPE= 0.17)

There are discrepancies in the data before and after 2012, we did the sensitivity analyses for checking the robustness of the two models (i.e., using data from 1999-2017 and 2002-2017). The results of the sensitivity analyses are shown in the Supplement Files. The results were quite consistent between the model using data from 1999-2017 and the model using data from 2002-2017, indicating our models are quite robust.
The significant predictors identified at the previous multivariable model (dengue cases at lag 1-4, 5-8, and 9-12 weeks; wind speed at lag 5-8 and 9-12 weeks; temperature amplitude and humidity at only lag 5-8 weeks; rainfall at lag 1-4, 5-8, and 9-12 weeks) have been further analyzed, then converted β-coefficients to prediction score scale. Prediction factors were divided according to the following categories: <50th, ≥50-75th, ≥75-95th, ≥95th percentile of the data. Then the β-coefficients at each category will be assigned a suitable score (Table 3). The temperature amplitude and humidity were excluded because there was no statistical significance in the score model.
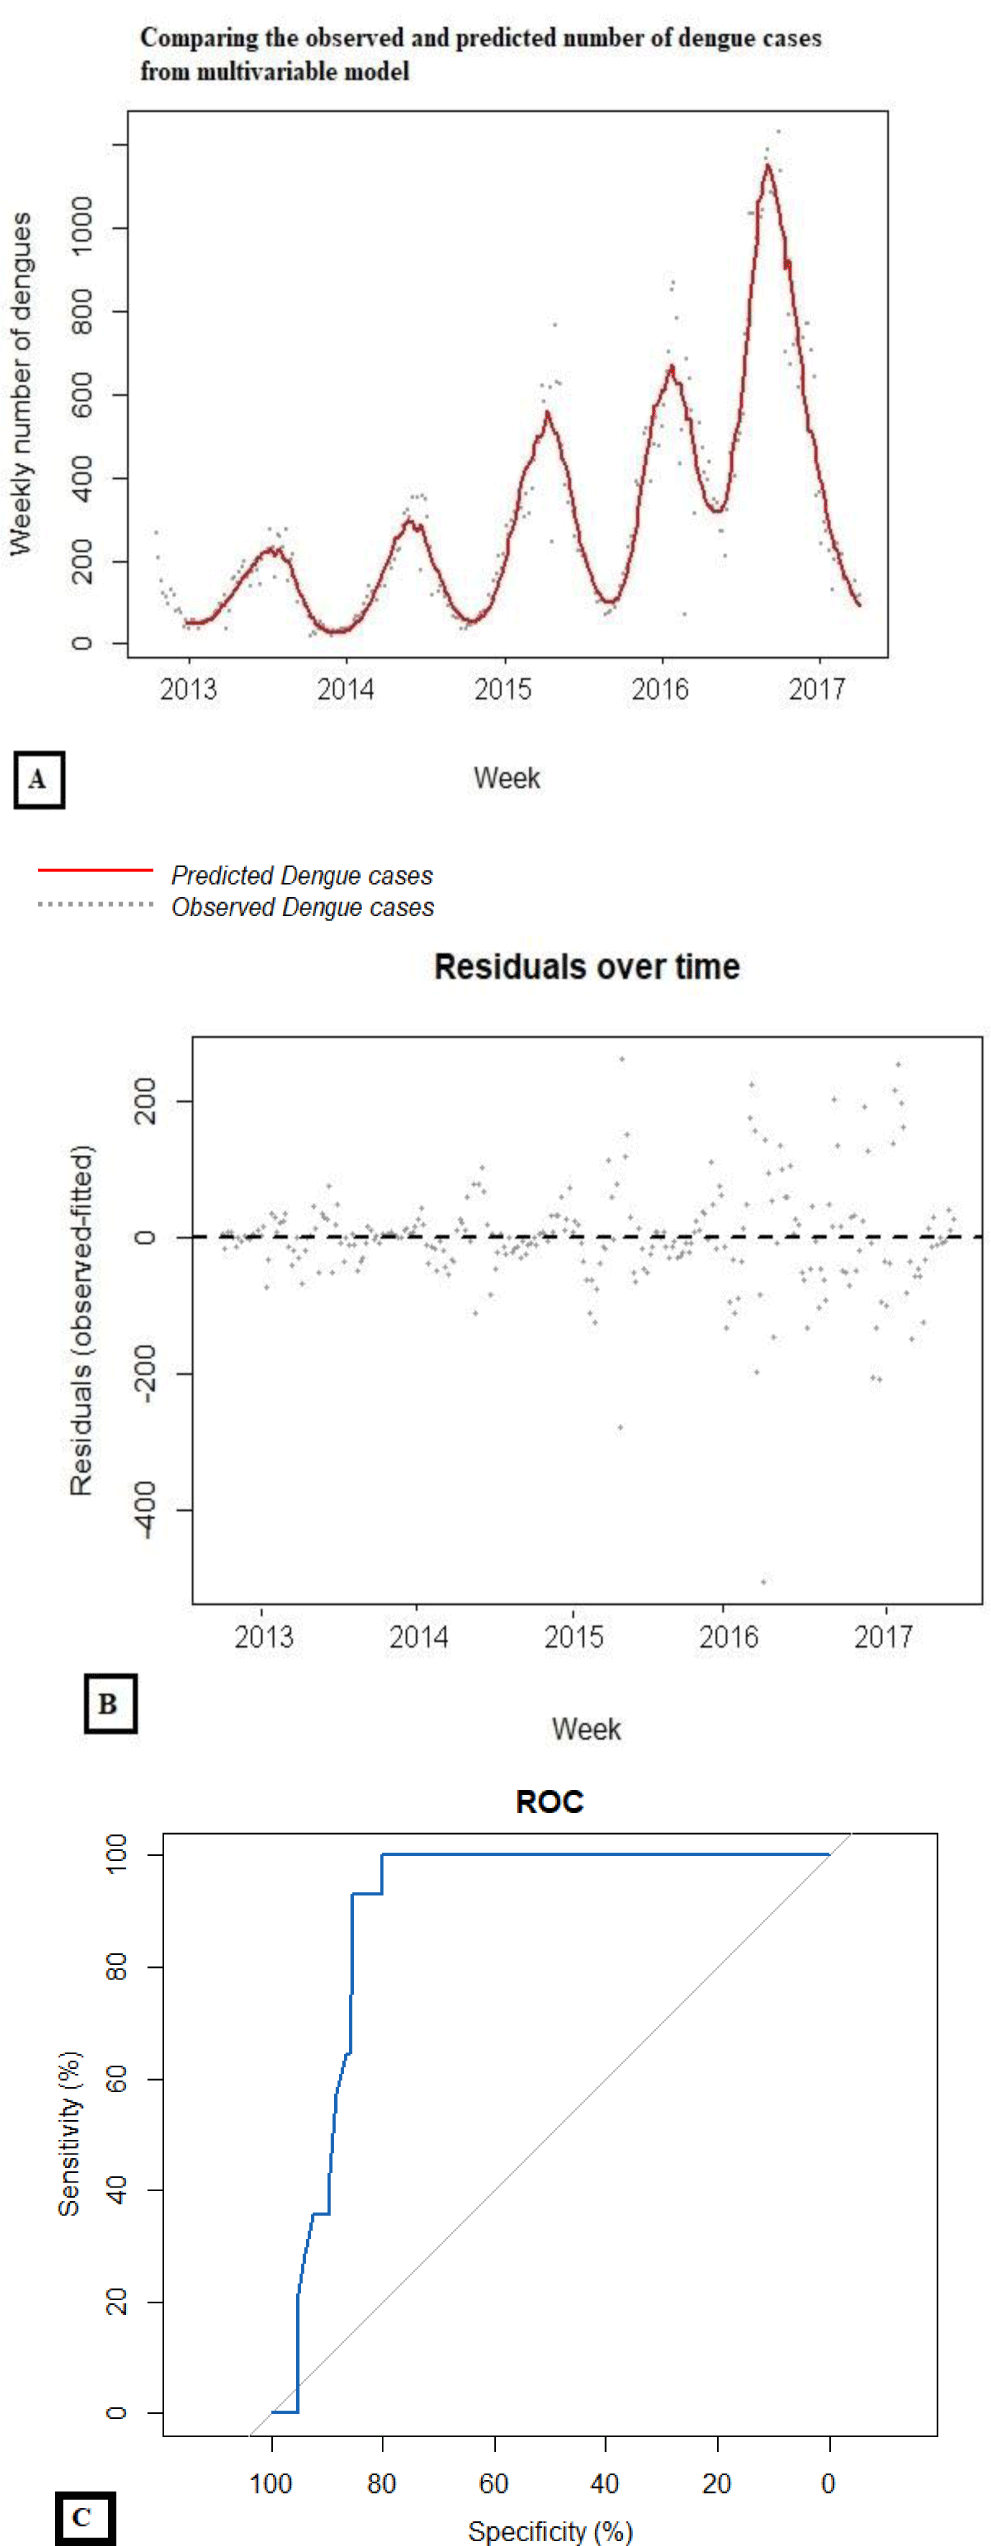
To check the model’s prediction ability, besides compared forecasts and actual dengue cases (Panel A and B, Figure 4), we also conducted a assess the accuracy of the score in diagnosing the outbreaks of dengue (defined as number of cases exceed the 95th percentile of weekly cases) using the ROC curve (Figure 4). The area under the curve obtained was AUC = 0.812, which shows a very good predictive ability of the model. The model predicted the best at the 0.0497 cut-point (equivalent to -76 scores), and the sensitivity and specificity of the prediction score model were 1.00, and 0.8 respectively.

4. DISCUSSION
Ho Chi Minh city had a high number of dengue cases, with around 149 reported cases per week in an outbreak. The cause may be that Ho Chi Minh city is the most populous city in Vietnam (7,660,300 people in 2012), the high urbanization rate leads to the high total number of cases, quickly spreading when the disease appears, difficult to control when the outbreak occurs. Weather factors are seasonal, which may be making the dengue fever have the same cyclical nature.
Our results are consistent with previous studies that found the majority character's effect on the number of dengue [13, 15, 29]. Weather factors may directly or indirectly impact vector developmental cycle and fertility, affecting dengue Spatio-temporal distributions [6, 17, 18, 21, 28, 32, 34]. Moreover, our model has been minimized in terms of the number of weather variables as well as the statistical complexity. In the model, we had found the correlation between the weekly numbers of Dengue and weather factors such as wind speed and rainfall. Higher wind speed is the cause of reducing the number of dengue. Previous studies had shown that wind speed less than the maximum flight speed of Aedes mosquitoes (2.7 m/s) is a favorable condition for the distribution of the vector as well as the process of laying their eggs. However, when the wind speed is greater than the threshold, mosquitoes can freely fly, they cannot pass easily to lay eggs as well as contact with humans to suck blood, hindering the process of eating blood and spreading the disease [14, 18, 25]. Background wind speed in Ho Chi Minh city is relatively high, which may be the reason for the negative correlation in the forecast model. Besides, the cumulative rainfall was also judged to be a negative correlation to the incidence. This cause is rainfall affects mosquito density. Many theories believe that increase rainfall create more breeding sites for mosquito, so, cause increase in the number of mosquitoes [11, 26, 32], but in reality, heavy rain will lead to flooding phenomenon, cause the mosquito eggs and larvae were washed away [9, 17, 19]. In months with higher rainfall, Ho Chi Minh city has a high cumulative rainfall, drainage systems are underdeveloped, so long-term flooding and drainage massively are the cause of killing mosquito eggs and larvae.
Temperature and humidity are important factors that have been shown to be associated with dengue infection [34-40], but in this study, we found no statistically significant association for building deague prediction model. To explain this result, it is possible that the changes in the characteristics of the study area as well as the statistical interaction of variables in the multivariable model have excluded these two factors from the model.
Our study is the first in Ho Chi Minh city to successfully establish a model for early prediction of dengue fever based on weather factors. We transformed the complicated statistical model into a simple score scheme, which shows very high accuracy in predicting dengue outbreaks. This scheme makes complex modeling results easier to practice by preventive workers and authorities to prevent and control better this disease. In this study, the model can predict the maximum lag time up to 12 weeks in public health; this is a significant period to plan dengue prevention and response.
The study has some limitations. First, due to the data availability, we only could build the model using data up to 2017. It warrants further study to use more recent data for model building and prediction. Second, we only used the weather factors to construct the prediction model; however, other factors such as vector monitoring, household condition, knowledge-attitude-practice of the population can also affect the dengue outbreak. Therefore, we will collect data from other factors for improving the validity of the prediction model.
Conclusions
In summary, our study indicated that weather features significantly cause the change of dengue number in Ho Chi Minh city, Vietnam. A simple prediction score scheme derived from the complicated statistical model can help health worker who are preventive practitioners and authorities in the epidemic areas using easier. We recommend further studies to confirm this study's results and apply the prediction score scheme in other areas to improve dengue outbreak prevention.
