1. INTRODUCTION
Hepatocellular carcinoma (HCC) has become the most prevalent of all hepatic malignancies worldwide [1], and ranks as the second cause of cancer-related death in men and the sixth in women [2]. Alpha-fetoprotein (AFP) has been most widely used as a serum diagnostic marker for HCC, and was added into the international guidelines for HCC surveillance [3,4]. AFP is a glycoprotein, that is highly expressed during fetal development and decreases progressively after birth [5]. In HCC patients, levels of AFP >400 ng/mL are considered reliable for confirming an HCC diagnosis [6]. In addition to being a diagnostic indicator, AFP has been identified as a type of growth regulator during tumor progression and oncogenic growth [7]. Several studies have reported that AFP is involved in pleiotropic activities that influence tumorigenesis, cell proliferation and differentiation [8,9]. Moreover, it has been indicated that cytoplasmic AFP induces HCC cell proliferation by stimulating the expression of Src and c-myc [10], while extracellular AFP can affect the proliferation and expression of HCC cells through AFP receptors on the cell membrane [11]. Several studies have indicated that the expression of AFP receptors correlates with AFP expression in the cells [12].
AFP/AFP receptors generate calcium ion (Ca2+) influx, after which cyclic adenosine monophosphate (cAMP) increases protease A activity, causing DNA synthesis, which, in turn, leads to tumor cell proliferation [13]. Moreover, recent studies have shown that P21Ras is promoted through cAMP-PKA, Ca2+, tyrosine protein kinase-Ras-mitogen-activated protein kinase, and several signaling pathways [14]. In addition, the phosphatidylinositol 3-kinase (PI3K) catalytic subunit can bind directly to Ras, and activate the PI3K/AKT signaling pathway [15]. The latter plays an important role in inhibiting apoptotic cells and enhancing proliferation by activating multiple downstream effector molecules [16]. Also, AFP can activate PI3K/AKT signaling pathway by inhibiting the function of phosphatase and tensin homolog. On the other hand, it can block the retinoic acid-RAR signaling pathway to promote tumor cell growth [17,18].
Furthermore, several mechanisms have been investigated that are involved in the development of HCC in patients, and accelerating cancer formation. These mechanisms include modifications in the macro- and microenvironments that stimulate cellular proliferation and telomere dysfunction [4]. At the end of eukaryotic chromosomes, telomeres play a crucial role in cellular survival, by maintaining genomic integrity in normal cells [20]. Chromosomal instability increases as telomeres progressively shorten during successive cell divisions. Their integrity is controlled by upregulation and reactivation of the catalytic subunit of the telomerase, the human telomerase reverse transcriptase (hTERT), in 90% of cancer cells [21]. In addition, this enzymatic protein complex, with its reverse transcriptase role, comprises an RNA component known as human telomerase RNA that acts as a template for DNA telomere synthesis, and plays a role in the localization, catalysis, and assembly of the telomerase holoenzyme [22]. In addition to its canonical role, expression regulation, apoptosis, cell proliferation, WNT/β-catenin signaling, PI3K/AKT/mTOR signaling, cell migration, and cell adhesion, also involve telomerase [23]. Several studies have shown that telomerase activity and hTERT expression are regulated by several transcriptional activators and repressors such as c-myc and Sp1 and Mad1 respectively [24], as well as by posttranscriptional regulators such as AKT, c-Abl, and protein kinase C (PKC) by kinase phosphorylation [25].
PKC, a class of serine/threonine kinases with diverse biological functions, plays a crucial role in transmembrane signal induction and transduction of many cellular responses (gene expression, proliferation, differentiation, survival, apoptosis and motility) [26]. Pharmaceutical companies and academic laboratories have recently reported an association between PKCs cancer cell metabolism [27]. Eminent levels of PKC can be found in urinary bladder, prostate, breast and lung cancers[28-32]. PKCs are classified into three groups. “classical” or “conventional” (α, βI, βII and γ), “novel” (δ, ε, η and θ) and “atypical” (ζ, i and λ) [26]. Unlike other kinases that are implicated in cancer, such as Erk, AKT and JNK, PKC phosphorylation does not correlate mainly with activation status [33]. In fact, several studies have suggested that when the expression of PKC family members is altered, they may function as either oncogenes or tumor suppressors. Although specific carcinogens might induce alterations and phosphorylation in the protein kinase expression [34], the role of PKC in HCC remains unclear. New studies reversed the paradigm and identified PKC as a tumor suppressor [35,36]. Hence, new therapeutic targets for treating human diseases can be identified by understanding the molecular mechanisms through which a particular PKC isoform monitors cellular signaling pathways [37].
2. MATERIALS AND METHOD
Four cancer cell lines were purchased from American Type Cell Culture (Manassas, VA, USA). HepG2/C3A, PLC/PRF/5, SNU-387, and SK-OV-3 (or SKOV-3). C3A is a clonal derivative of HepG2 selected for its high production of alpha-fetoprotein (AFP) as well as for its ability to grow in glucose-deficient medium. This cell line strongly expresses telomerase, however, there is no evidence of a hepatitis B virus genome. PLC/PRF/5 are hepatic, adherent epithelial cells that secrete AFP, express telomerase and produce hepatitis B surface antigen (HbAg). The SNU-387 cell line is isolated from a primary hepatocellular carcinoma expressing telomerase but not AFP. In addition, they contain the hepatitis B virus since the DNA of the virus was detected by Southern blot, however, the genomic RNA of the HBV is not expressed. HePG2/C3A, PLC/PRF/5, and SNU-387 were cultured in Dulbecco’s Modified Eagle’s Medium (DMEM), minimum essential medium eagle (Sigma-Aldrich, Munich, Germany), and DMEM Nutrient Mixture F-12 (DMEM/F-12), respectively. SKOV-3 (hTERT negative [-/-]), an ovarian cancer cell line, expressing neither telomerase nor AFP, was cultured in DMEM/F-12 (Sigma-Aldrich). All media were supplemented with 10% fetal bovine serum, and 1% antibiotics (penicillin/streptomycin) (Sigma Chemical Co., St. Louis, MO, USA); 1% nonessential amino acids (Sigma, USA) was supplemented for only HepG2/C3A, and were incubated at 37°C in 5% CO2.
RNA was extracted using the NucleoSpin® RNA extraction kit (Macherey-Nagel, Düren, Germany) from the different cell lines, according to the manufacturer’s instructions. The RNA quality and yields were analyzed using the Nanodrop Spectrophotometer. Complementary DNA (cDNA) was then synthetized by reverse transcription of 100ng of total RNA in a 20μl total volume; using the iScript cDNA Synthesis Kit (Bio-Rad, Laboratories,CA, USA).
Semi quantitative reverse transcription polymerase chain reaction (RT-PCR) was conducted, and the genes of interest were amplified in triplicate using 5X FIREPol® Master Mix (Solis BioDyne, Tartu, Estonia). The sequences of the PCR primers for glyceraldehyde-3-phosphate dehydrogenase (GAPDH), PKCα, PKCβI, PKCβII, PKCδ, PKCε, and PKCγ are shown in Table 1.
Reactions were initiated at 95°C for 3 min, followed by 55°C (for PKC isoforms) and 60°C (for GAPDH) for 30 s, and by 72°C for 1min (for PKC isoforms) or 70°C for 30 s (for GAPDH), and 35 cycles for PKC and GAPDH, followed by a final elongation step at 72°C for 5 min. The amplified DNA was run on 2% agarose gel and visualized using SYBR® Safe DNA Gel Stain (Invitrogen, Life Technologies, USA) using the UVP BioDoc system (Analytik Jena US LLC., Upland, CA, USA). Data analysis and gel image evaluation were conducted using the GelAnalyzer software and GAPDH was used as internal control gene to normalize PKC isoforms’ levels.
Cells were treated with a 5 μM pan-PKC inhibitor Go 6983, 10μM PI3K inhibitor PI 828, 100nM AKT inhibitor GSK 690693, 200 nM mTOR inhibitor Rapamycin from Tocris (Tocris Bioscience,Bristol, UK), and 10 and 20 μM AFP inhibitor all-trans retinoic acid (ATRA) purchased from (Millipore Sigma, Burlington, MA, USA).
The small interfering RNAs (siRNAs) were used for PKCα, PKCβ, PKCδ, PKCε, PKCγ and hTERT. Cell death siRNA was used as a positive control for transfection and nonsilencing siRNA was used as negative control. These were purchased from Qiagen (Valencia, CA, USA), and the transfection was conducted according to the manufacturer’s instructions. Briefly, 10nM siRNA diluted with serum-free medium and Hi-perfect (Qiagen) were added to the wells of 24-well and 6-well plates and incubated at room temperature. After 15 min, HepG2/C3A and PLC/PRF/5 cell were seeded, and incubated for 72 h. PKC isoforms and hTERT siRNA sequences are shown in Table 2. Specific downregulation of PKCα, PKCβ, PKCδ, PKCε, PKCγ and hTERT was confirmed by qRT-PCR (S2_Fig).
The levels of AFP secreted into the cell media of the different cell lines were measured using the sandwich enzyme-linked immunosorbent assay (ELISA) technique (AFP ELISA kit from (Human Biochemica und diagnostic GmbH Germany) according to the manufacturer’s instructions. Briefly, after each treatment the supernatant was collected, diluted 1/50 with serum-free media for HepG2/C3A cells only, and assayed. The optical density was measured at 450nm using an ELISA reader (Thermo Fisher Scientific, Inc).
To evaluate the expression of each isoform, and the effect of the isoform silencing on AFP and hTERT expressions, qRT-PCR was conducted. The QuantiFast SYBR Green PCR Kit (Qiagen) was used to amplify cDNA samples. The primers sequences are shown in Table 3.
Rotor-Gene Q PCR cycler (Qiagen) was used to amplify cDNA through a PCR program of 35 cycles, with denaturation at 95°C for 10s, followed by annealing at 60°C for 30s, and elongation at 72°C for 10 s and then assessing the melting curve from 55°C to 95°C.
The 2–△△Ct method was used to calculate the relative fold gene expression level. PKC isoform, AFP and hTERT expression levels were normalized to the expression of GAPDH serving as internal control gene. All samples were analyzed in at least three independent experiments.
AFP expression plasmid pCMV3-AFP was purchased from Sino Biological Inc. and the wild-type (WT) hTERT expression plasmid Pbabe-neo-hTERT and the scramble vector Pbabe-neo were purchased from Addgene (Addgene plasmid #1774, #1775, and #1767 respectively).
After being transformed using the heat shock technique, the Escherichia coli DH5α strain was spread using a sterile loop onto a prepared lysogeny broth (LB) agar plate containing ampicillin to isolate individual colonies of bacteria carrying the plasmids cited above and incubated overnight at 37°C. After 24h, one colony was transferred into LB media + ampicillin and incubated at 37°C for 24h while shaking. After incubation, bacterial growth was characterized by a cloudy haze in the media. The plasmids were extracted and purified from the transformed and proliferated E. coli DH5α using the GenElute HP Plasmid Maxiprep kit (Sigma-Aldrich).
The cells were then transfected using the fast-forward protocol with Attractene Transfection Reagent (Qiagen) following the manufacturer’s instructions. After 24 and 48 h of transfection, RNA was extracted as previously described. AFP, hTERT, and PKC isoform levels were quantified using qRT-PCR as described above.
Cells were extracted for use in assessing telomerase activity using the following methods. First the cells were trypsinized and centrifuged at 2000rpm for 5min; washed three times with PBS, centrifuged and resuspended at 106 cells/200μl lysis buffer (3-[(3-cholamidopropyl)-dimethylammonio]-1-propane-sulfonate, 10 mM Tris pH 8.0). Second, the lysate was incubated on ice for 30 min, and centrifuged at 12000g at 4°C for 20min. Finally, aliquots of the supernatant were collected. BCA Protein Assay (BioRad) was used to determine the protein concentration in the extracts.
For the real-time quantitative telomeric repeat amplification protocol, 1μL cell lysate (0.5μg/μL), telomerase primer TS (5’-AATCCGTCGAGCAGAGTT-3’) and reverse primer ACX (5’-GCGCGGCTTACCCTTACCCTTACCCTAACC-3’) were used. Samples were incubated at 37°C for 30 min, at 95°C for 10min and then amplified for 40 cycles (5sec at 95°C and 60 sec at 60°C).
Data were analyzed using Rotor-Gene Q (Qiagen) which integrates the RT-PCR effectiveness that was calculated by the successive dilution of the most active sample.
Cell proliferation was determined using the colorimetric method based on the oxidation of 2-(2-methoxy-4-nitrophenyl)-3-(4-nitrophenyl)-5-(2, 4-disulfophenyl)-2H-tetrazolium and monosodium salt (WST-8) (Sigma-Aldrich) in the cell mitochondria. HePG2/C3A and PLC/PRF/5 cells (105 cells) were transfected according to the manufacturer’s protocol in a 96-well culture plate with 10nM siRNA using HiPerfect Transfection Reagent (Qiagen). After 72h, 10μL tetrazolium salt was added to each well. The added product was cleaved into formazan using an enzyme—succinate-tetrazolium reductase—that exists only in the mitochondrial respiratory chain. The number of living cells in the culture was proportional to the formazan produced and were evaluated using an ELISA reader at 450nm.
The experimental data are expressed as the mean ± SD from at least three experiments. The analysis of variance and unpaired two-tailed Student’s t-test were conducted to determine significant differences among more than two groups or between only two groups, respectively. P ≤ 0.05 was considered significant.
3. RESULTS
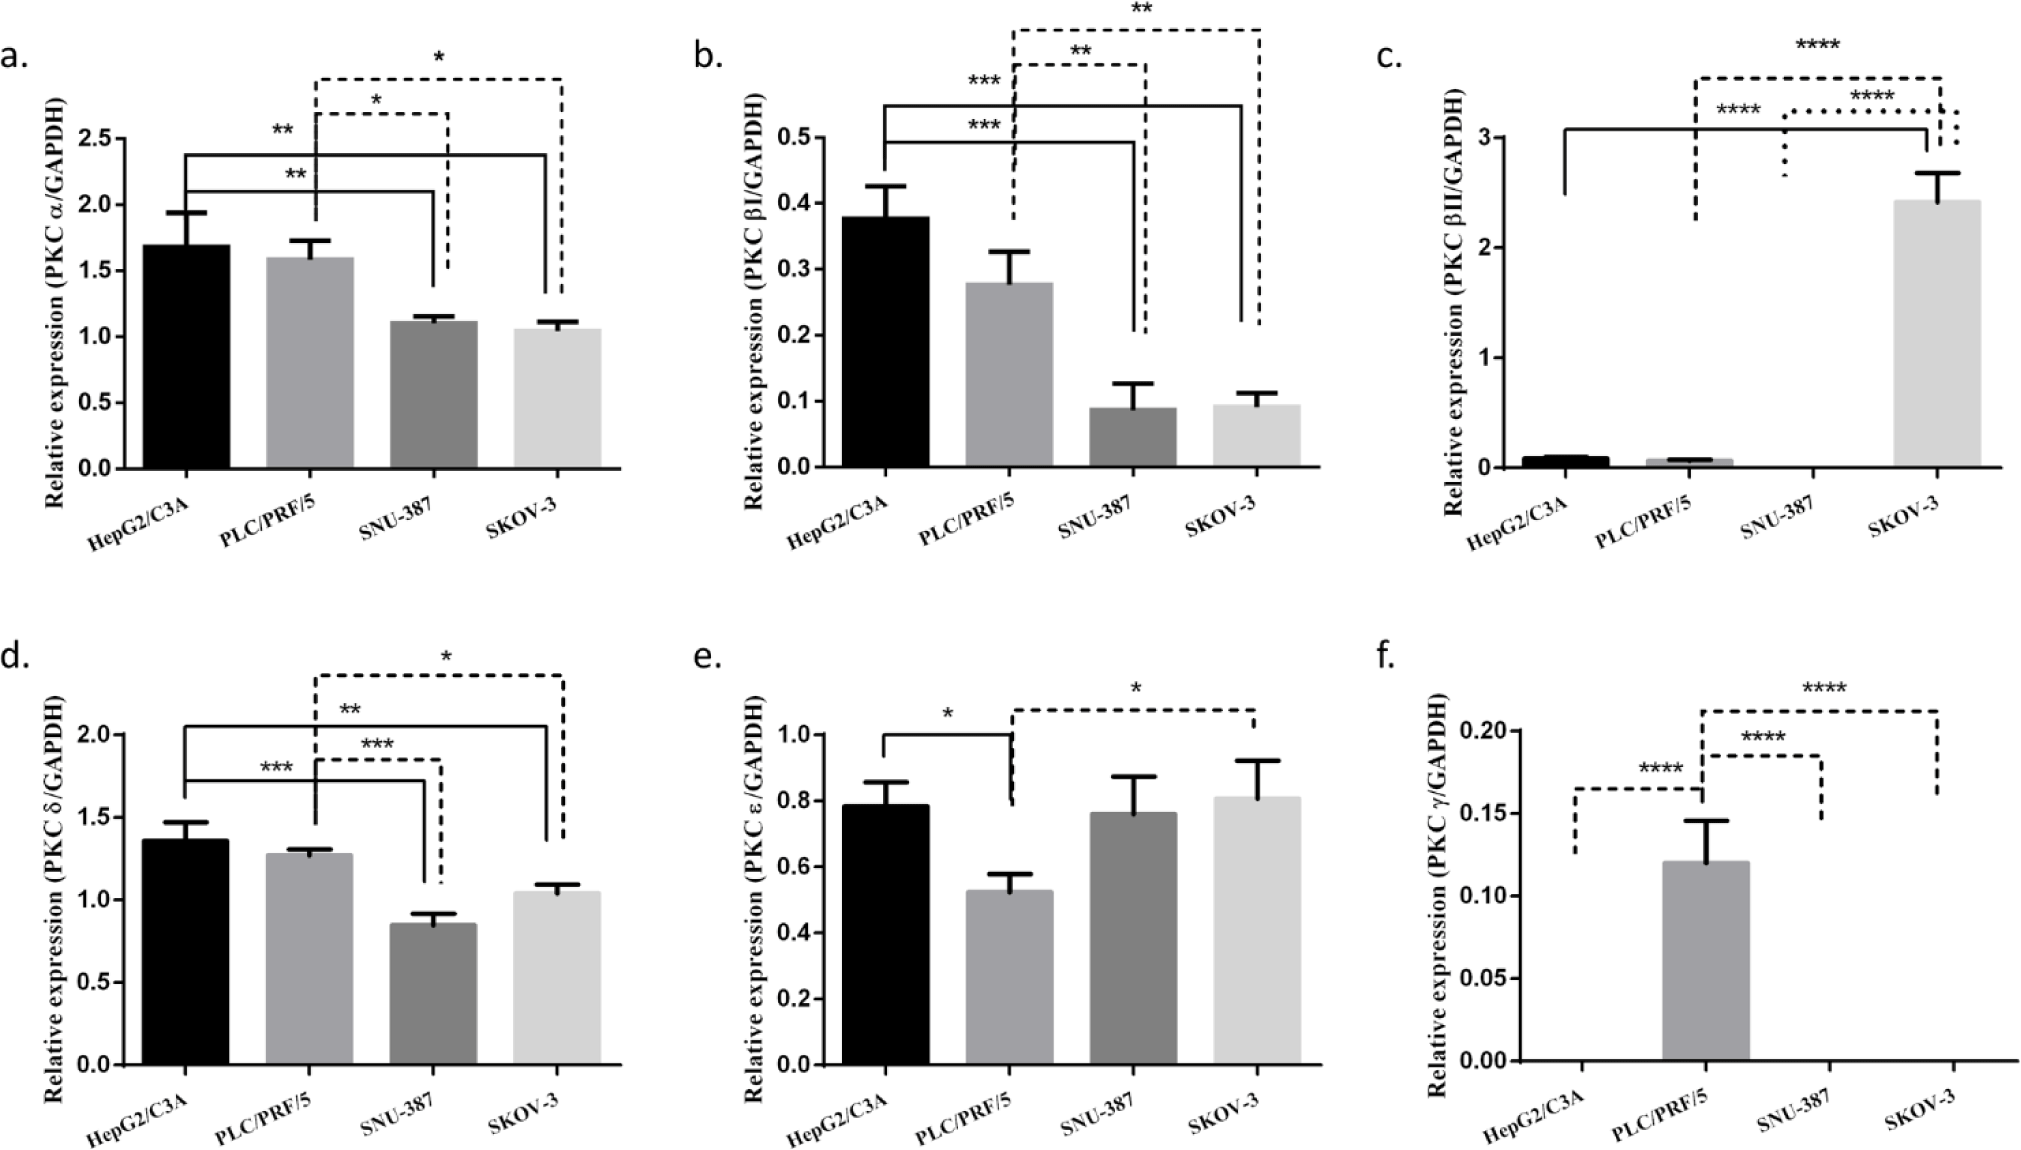
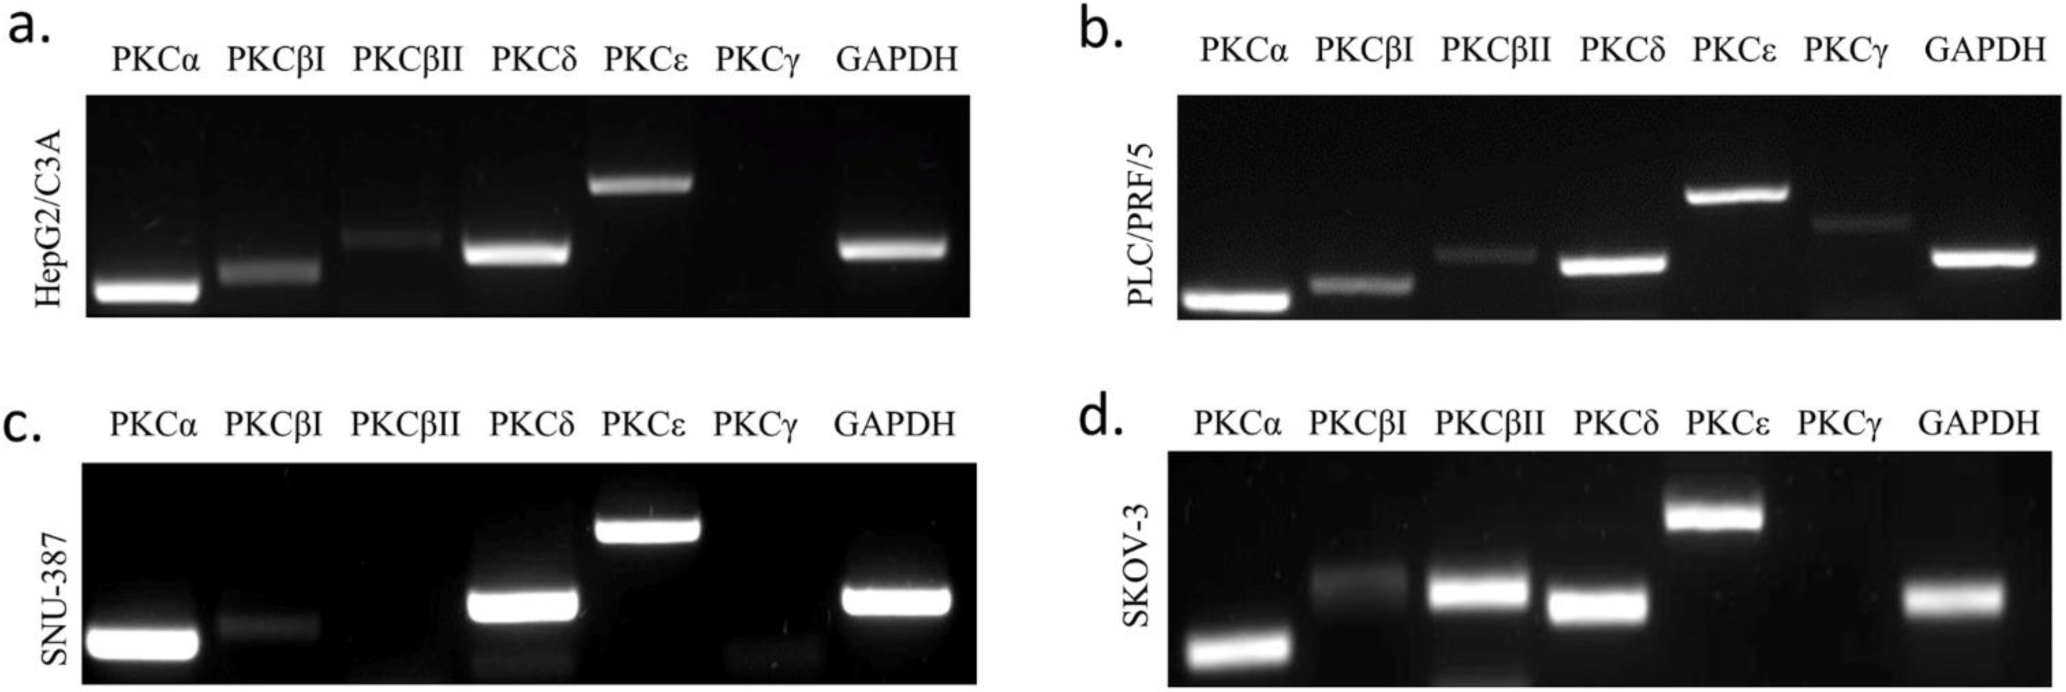
We investigated the expression of each PKC isoform in three different HCC cell lines HePG2/C3A, PLC/PRF/5, and SNU-387. Their expression was also studied in an ovarian cancer cell line SK-OV-3 (hTERT -/-) (Fig 1). Cells were cultured as previously described and then PKC isoforms expression was assessed using RT-PCR. We observed that PKCα and PKCδ were highly expressed in the four studied cell lines, and their expression levels were more significant HepG2/C3A and PLC/PRF/5 (AFP +/+). Moreover, we observed that PKCδ’s expression level was more pronounced in HePG2/C3A, the cell line with the higher level of AFP expression.. PKCβI was observed to be lightly expressed in the four studied cell lines; however this expression was more pronounced in the AFP secreting cell lines. PKCβII was highly expressed exclusively in the hTERT and AFP-negative cell line, SKOV-3.. However, of the two remaining isoforms normally expressed in HCC, PKCε was observed to be significantly expressed in all four cell lines, whereas PKCγ was slightly and exclusively expressed in PLC/PRF/5, with no significant association with either the presence or absence of AFP or hTERT (S1_Fig).
To ensure whether AFP’s presence had an effect on the expression of the different isoforms, the expression and secretion of AFP was studied in two AFP-negative cell lines, SNU-387(hTERT+) and SK-OV-3(hTERT-) (Figs 2a-b-c-d-e). We transfected these cells using two different constructs an empty vector as a control and an AFP construct (pCMV3-AFP). Interestingly, our results showed that pCMV3-AFP significantly increased AFP expression 24h post-transfection (p=0.0004 for SNU-387(p= 0.0004 for SNU-387 and p= 0.0058 for SKOV-3) (Fig 2a). In conformity with the post-transfection levels of AFP mRNA, SNU-387and SKOV-3 transfection with (pCMV3-AFP) increased PKCα mRNA levels 0.4-fold (p=0.0021) and 0.5-fold (p=0.02) respectively (Fig 2-b). PKCβI levels increased 0.5-fold (p=0.01214) in SNU-387 and 2.8-fold (p=0.003) in SKOV-3 (Fig 2-c). Moreover, PKCδ expression levels also increased 0.2-fold (p=0.0093) and 0.95-fold (p=0.0189) in SNU-387 and SKOV-3 cells respectively (Fig 2-e).
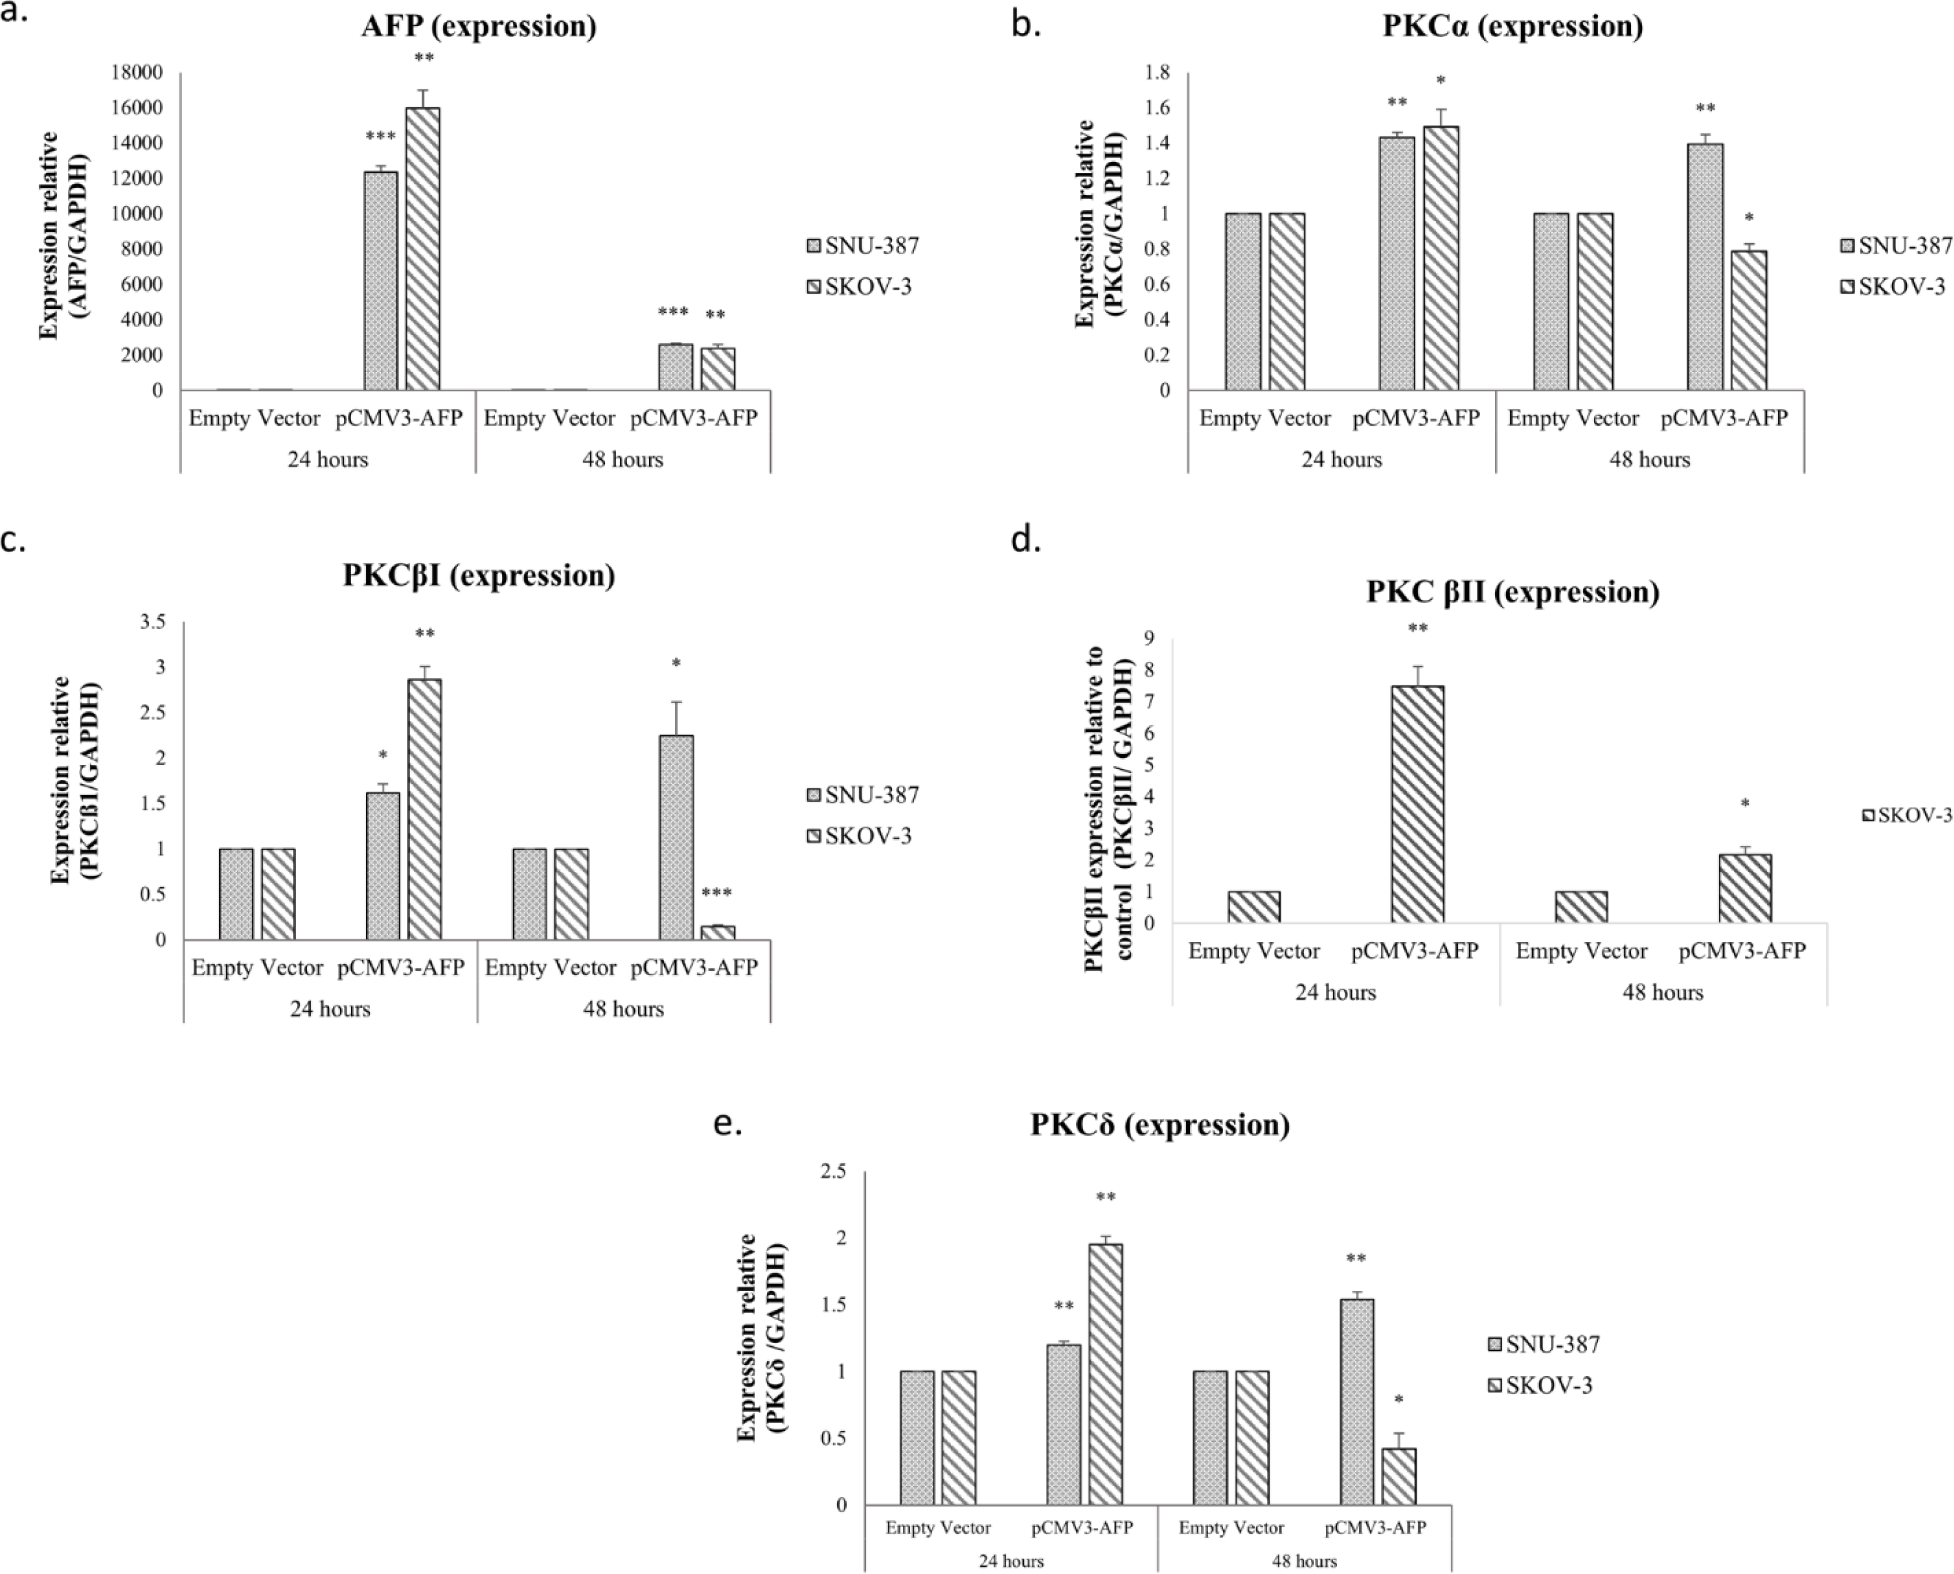
We also studied the effect of pCMV3-AFP on the expression level of PKCβII in SKOV-3, the cell line most expressing this isoform. Our results shows that the expression level of PKCβII increased significantly after 24 hours (p=0.0046) (Fig 2-d). After 48h, the increase in expression levels remained steady in SNU-387 but decreased in SKOV-3 by 0.5, 2, 5 and 1.5-fold for PKCα, PKCβI, PKCβII and PKCδ respectively (Fig 2-b-c-d-e).
To better understand the effect of AFP on PKCα, PKCβI, PKCβII and PKCδ expressions, we investigated whether the inhibition of AFP could also be implicated in regulating isoform expressions in the studied cell lines. To determine this, HepG2/C3A and PLC/PRF/5 cells were treated with 10 μM ATRA. After 48h, total RNA was extracted and PKC isoforms’ expression levels were assessed using RT-PCR. Our results showed that 10 μM ATRA significantly decreased the expression levels of PKCα, PKCβI, PKCβII and PKCδ in HepG2/C3A cells (p=0.0154, p=0.0062, p=0.0062 and p=0.0001, respectively) (Fig 3-a). Interestingly, in PLC/PRF/5, PKCα, PKC βI and PKC βII expression levels significantly decreased after ATRA treatment (p<0.05), whereas PKCδ expression significantly increased (p<0.01) (Fig 3-b).

Our results showed that PKC βII is expressed more in the AFP (-/-) and hTERT (-/-) cell line; SKOV-3. To confirm that hTERT plays a role in regulating PKC isoform expression, hTERT was knocked down in SNU-387(AFP (-/-) and hTERT (+/+)) and in HepG2/C3A (AFP (+/+) and hTERT (+/+)) cells. Interestingly, our results showed that while hTERT expression decreased 72hours after knockdown (Fig 4a), PKCβII expression levels significantly increased by 6.4-fold in SNU-387 and by 0.5-fold in HepG2/C3A (Fig 4b).

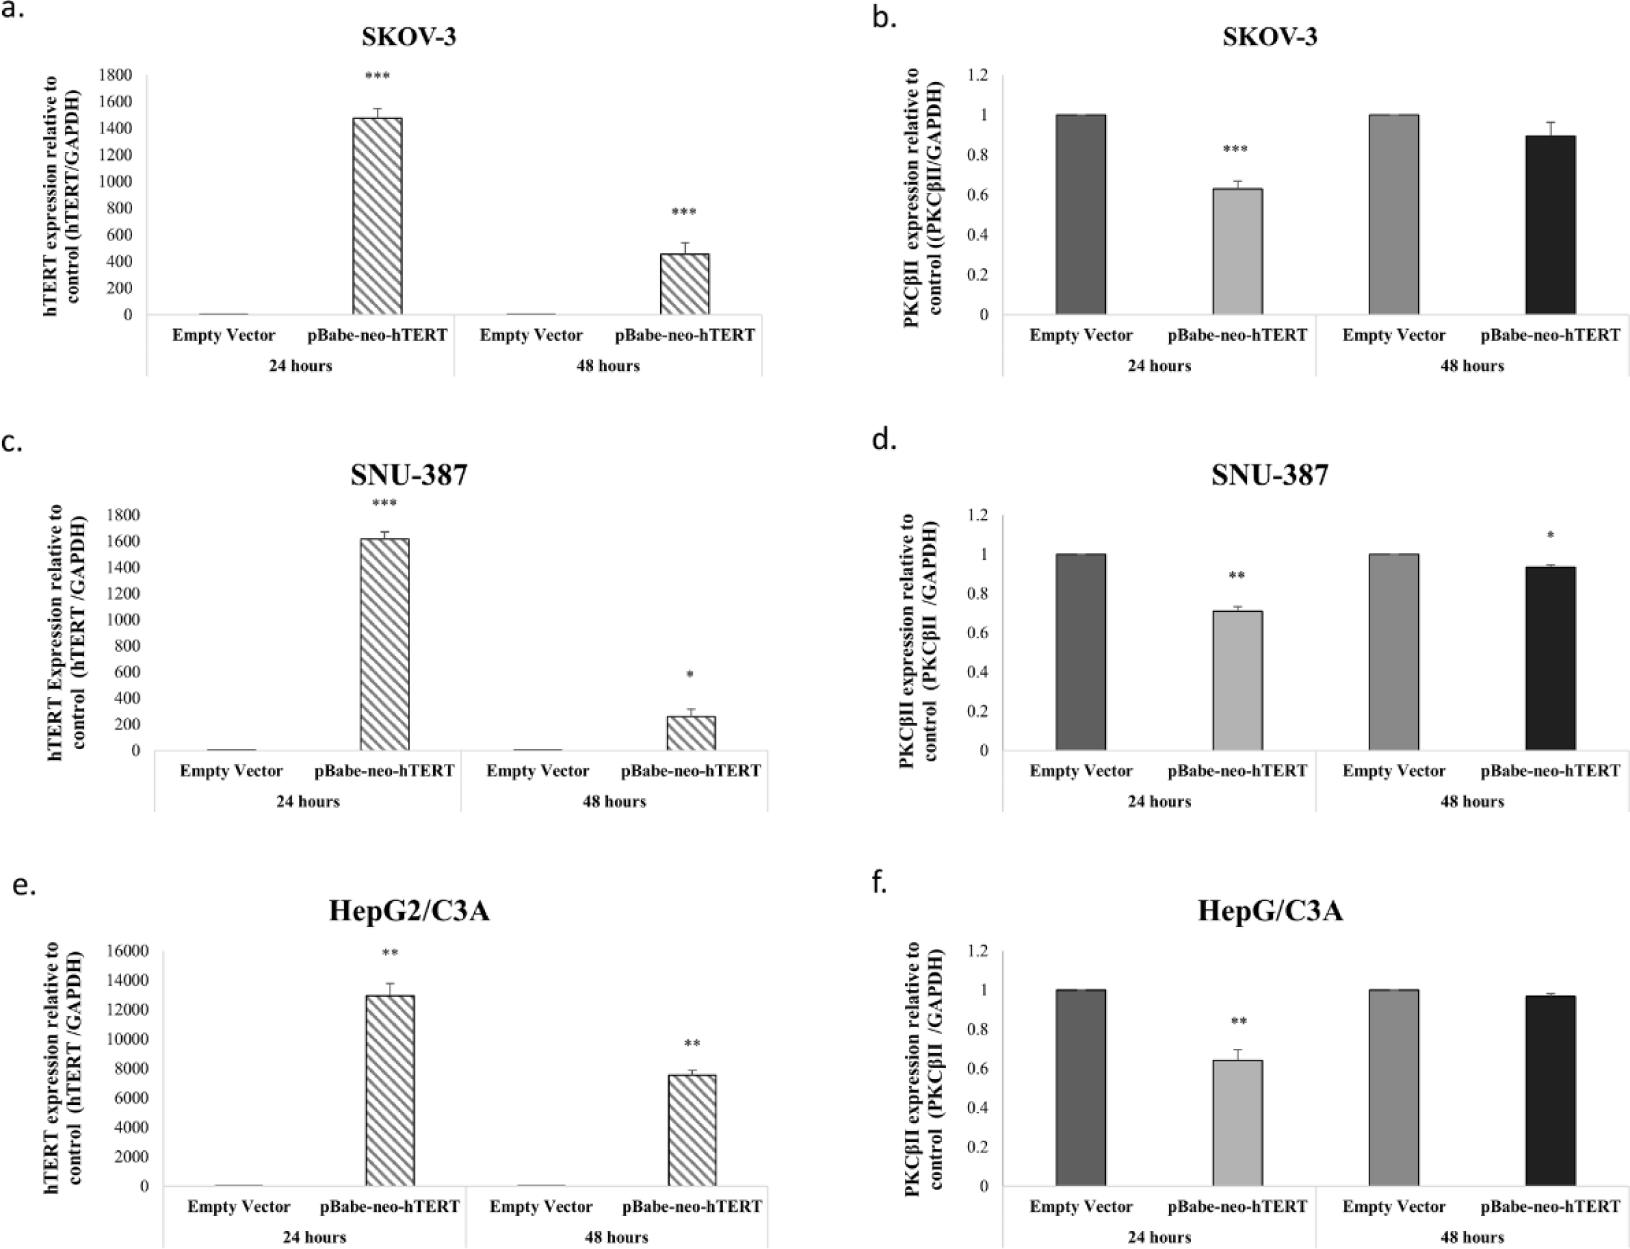
To further evaluate the effect of hTERT, we overexpressed hTERT in SKOV-3, SNU-387 and HepG2/C3A, by transfecting these cell lines with two different constructs an empty vector as a control and hTERT-WT construct. The efficiency of the transfection was then evaluated by assessing hTERT levels using RT-PCR. Our results showed that hTERT expression significantly increased 24h post-transfection and then decreased after 48h following cells transfection with hTERT-WT (Figs 5a-c-e). Interestingly, relative to hTERT expression levels, SKOV-3, SNU-387 and HepG2/C3A transfection with hTERT-WT decreased PKCβII expression levels 0.4-fold (p=0.001), 0.3-fold (p=0.033) and 0.36-fold (p=0.011) (Figs 5-b-d-f) respectively.
To investigate the effect of PKC isoform inhibition on AFP secretion, we treated HepG2/C3A cells with PKCα, PKCβ, PKCδ and PCKε siRNAs and PLC/PRF/5 cells with PKCα, PKCβ, PKCδ, PCKε and PKCγ siRNAs that were constructed and used to abolish the expression of the cited isoforms in the two cell lines. It is worth mentioning that these isoforms are the five that are the most expressed in HCC and, especially, in the cell lines used in this study. After knockdown of the different PKC isoforms expression, secreted AFP levels were determined using ELISA.
The evaluation of AFP concentration levels after isoforms’ knockdown, showed that PKCα knockdown (Fig 6-a) increased AFP secretion by 37% (p=0.0011), and that PKCβ, PKCδ and PCKε knockdown by siRNA significantly increased AFP secretion by 15% (p=0.0011), 27% (p=0.0074), 19% (p=0.038), respectively in the media of HepG2/C3A cells.
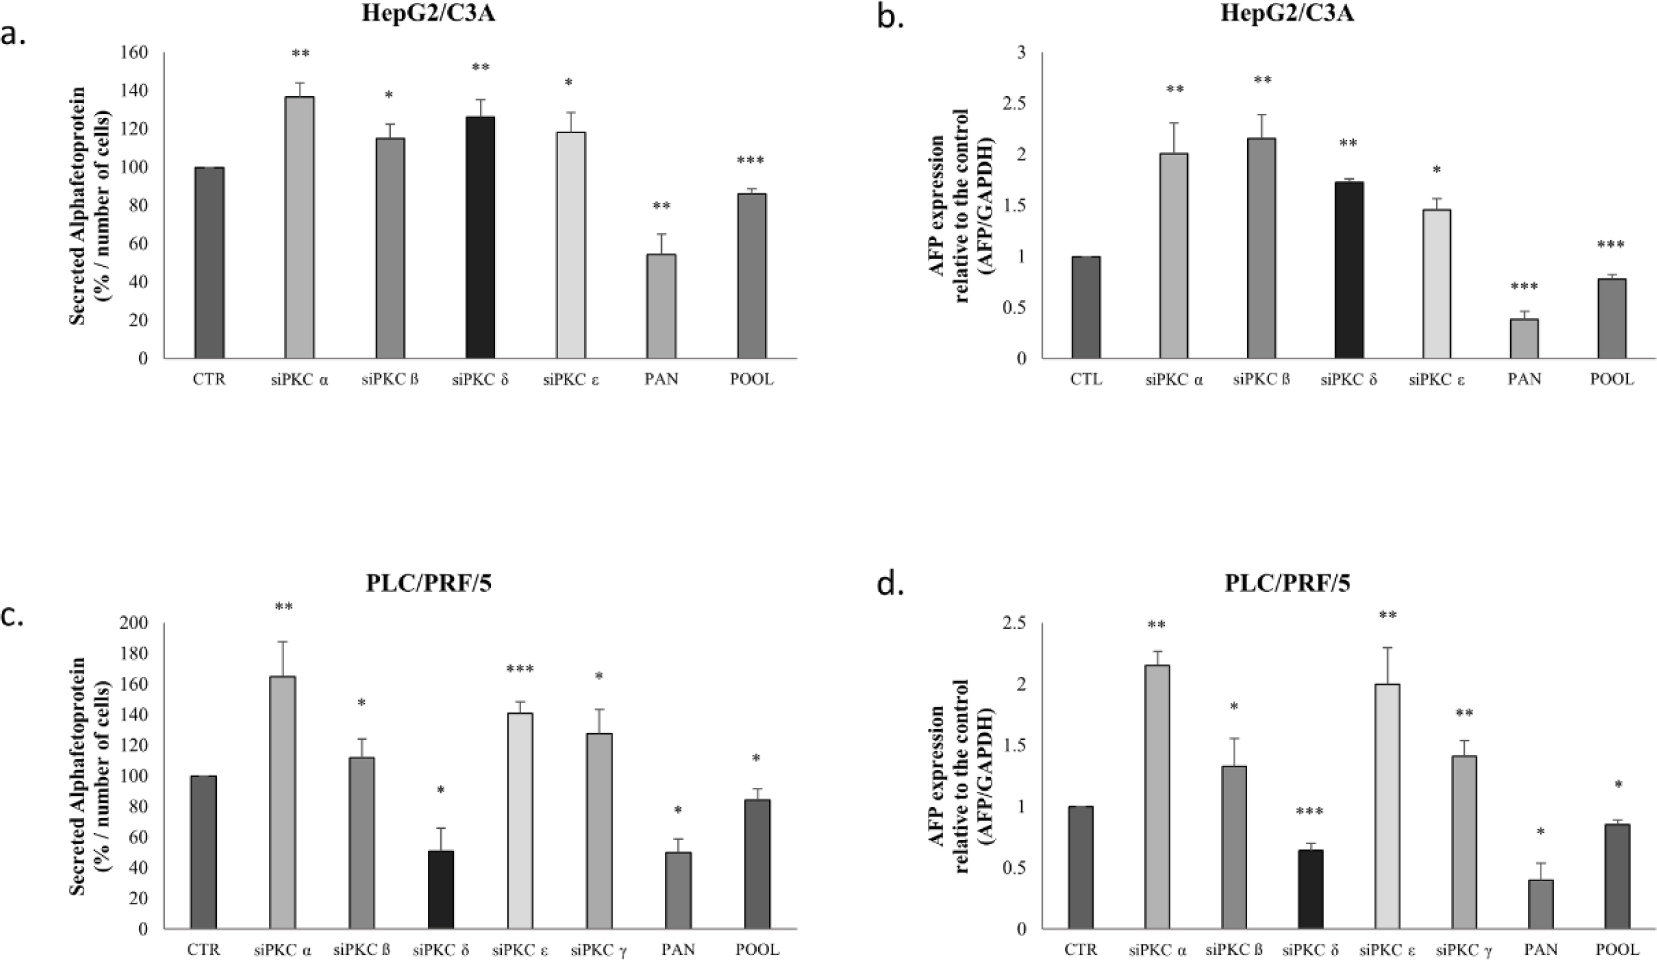
A similar pattern was observed in transfected PLC/PRF/5 cells (Fig 6-c); however, silencing of PKCδ decreased AFP secretion by 50% in the cellular medium.
Moreover, cells treated with pan-PKC inhibitor (Go 6983) and with a pool of siRNAs (PKCα, PKCβ, PKCδ, PCKε and PKCγ) led to a significant decrease in AFP secretion in HepG2/C3A cells (p≤0.001) and PLC/PRF/5 cells (p<0.05) (Figs 6-a-c).
Furthermore, the effect of PKC isoform inhibition was also assessed based on AFP mRNA expression. Knockdown of PKCα, PKCβ, PKCδ, and PCKε in HepG2/C3A cells increased AFP mRNA levels 2-fold (p=0.0061), 2.1-fold (p=0.045), 1.7-fold (p=0.0011), and 1.5-fold (p=0.0279) respectively (Fig 6-b).
PKCα, PKCβ, PCKε, and PKCγ siRNAs increased the expression levels of AFP mRNA in PLC/PRF/5 cells by 2-fold (p=0.005), 1.5-fold (p=0.023), 2-fold (p=0.0045), and 1.5-fold (p=0.0056), respectively; whereas PKCδ siRNAs increased AFP mRNA expression level (p=0.0004) (Fig 6-d).
On the other hand, our results show that treatment with Go6983 and the pool of siRNAs significantly decreased AFP mRNA expression levels (p<0.001) in both cell lines (Figs 6-b-d).
Next, we studied the effect of the PKC isoform knockdown on telomerase expression and activity. Remarkably, in HepG2/C3A cells, hTERT mRNA significantly increased 0.64-fold when treated with PKCα siRNA (p=0.0475), 0.32-fold with PKCβ siRNA (p=0.0324), 0.6-fold with PKCδ siRNA (p=0.0158) and 0.63-fold with PCKε siRNA (p=0.0296); however, after treating with Go 6983, hTERT mRNA decreased 0.7-fold (p=0.0021). A decrease of 0.3-fold in hTERT mRNA levels was also observed after treating with the pool of siRNA (p=0.0039) (Fig 7-a).
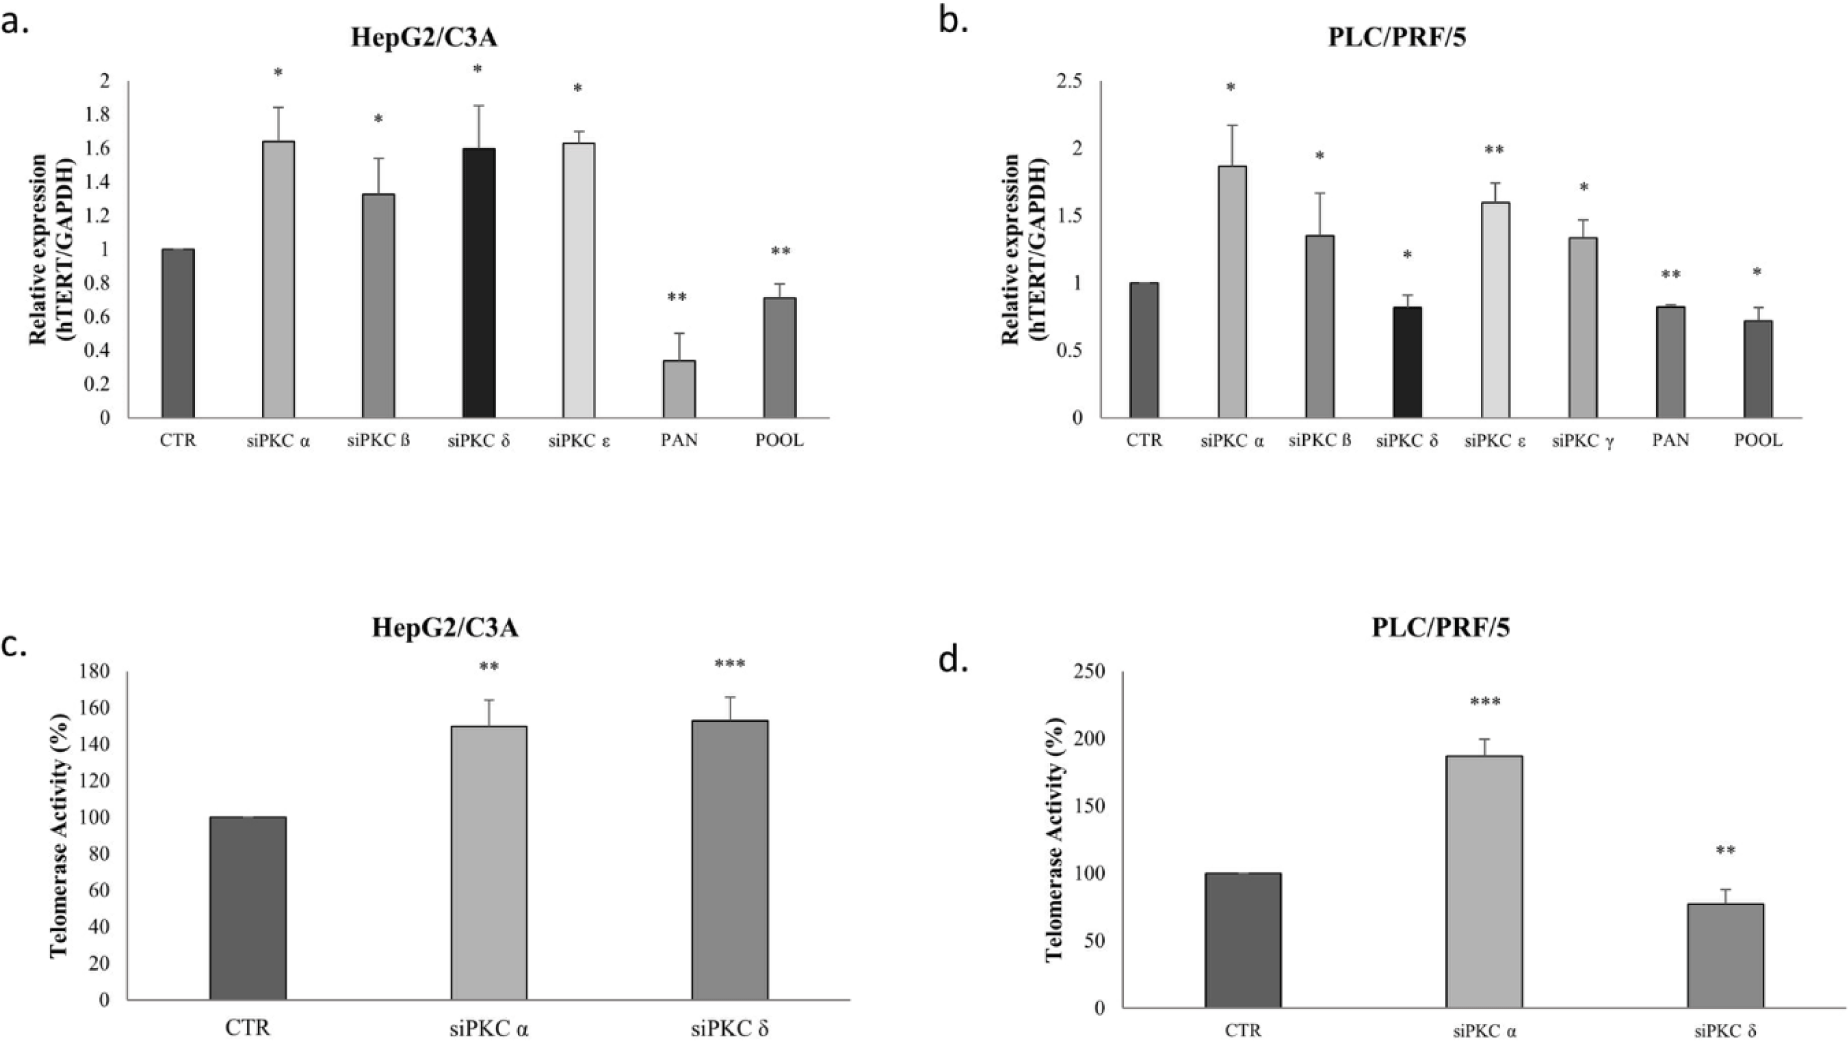
The results in the PLC/PRF/5 cells, were similar to those in the HepG2/C3A cells, as shown in Figure 7-b, except that the knockdown of PKCδ inhibited the expression of hTERT mRNA in the PLC/PRF/5 cells 0.2-fold (p=0.0269), but induced its expression in HepG2/C3A cells (Fig 7-a-b). When treated with Go 6983 and the pool of siRNAs, the expression levels of hTERT mRNA also decreased 0.2-fold (p=0.0042) and 0.3-fold (p=0.05) respectively in the two cell lines.
Because our results have shown that PKCα and PKCδ are the two most expressed isoforms in HepG2/C3A and PLC/PRF/5 cell lines, and given that they have interestingly different effects on AFP and hTERT expression, we have investigated their effect on telomerase activity and on PI3K/AKT/mTOR signaling pathway, known to be implicated in cell proliferation, migration, invasion, and apoptosis.
The inhibition of PKCα and PKCδ by siRNAs as shown in figure 7-c, increased telomerase activity of HepG2/C3A cells by 50% (p=0.0011) and 52% (p=0.0002), respectively; whereas in PLC/PRF/5, PKCα siRNA increased telomerase activity by 86% (p=0.0003), while PKCδ siRNA significantly inhibited telomerase activity by 28% (p=0.0019) (Fig 7-d).
Considering that PKCα and PKCδ knockdown modulated AFP expression levels and secretion, and, in parallel, regulated hTERT expression and activity in the studied cancer cell lines, we investigated whether this connection was ensured through regulation of hTERT or through PI3K/AKT pathway, one of the most activated signaling pathways in cancer cells, to elucidate the relationship that both PKCα and PKCδ might have with AFP.
To investigate the implication of PI3K/AKT/mTOR pathway in the correlation between PKC and AFP, AFP mRNA levels were evaluated following the inhibition of hTERT, PI3K, AKT, and mTOR using hTERT siRNA, 10μM PI828, 100nM GSK-690693, and 200nM rapamycin, respectively, on HepG2/C3A and PLC/PRF/5 cells.
Figures 8-a and c, clearly demonstrate a significant decrease in AFP expression levels (p≤0.05) for HepG2/C3A after these inhibitions, as well as a significant decrease in AFP expression levels (p=0.0176 (hTERT siRNA), p=0.0041 (PI828), p=0.05 (GSK-690693), p=0.01 (rapamycin)) for PLC/PRF/5 cells.
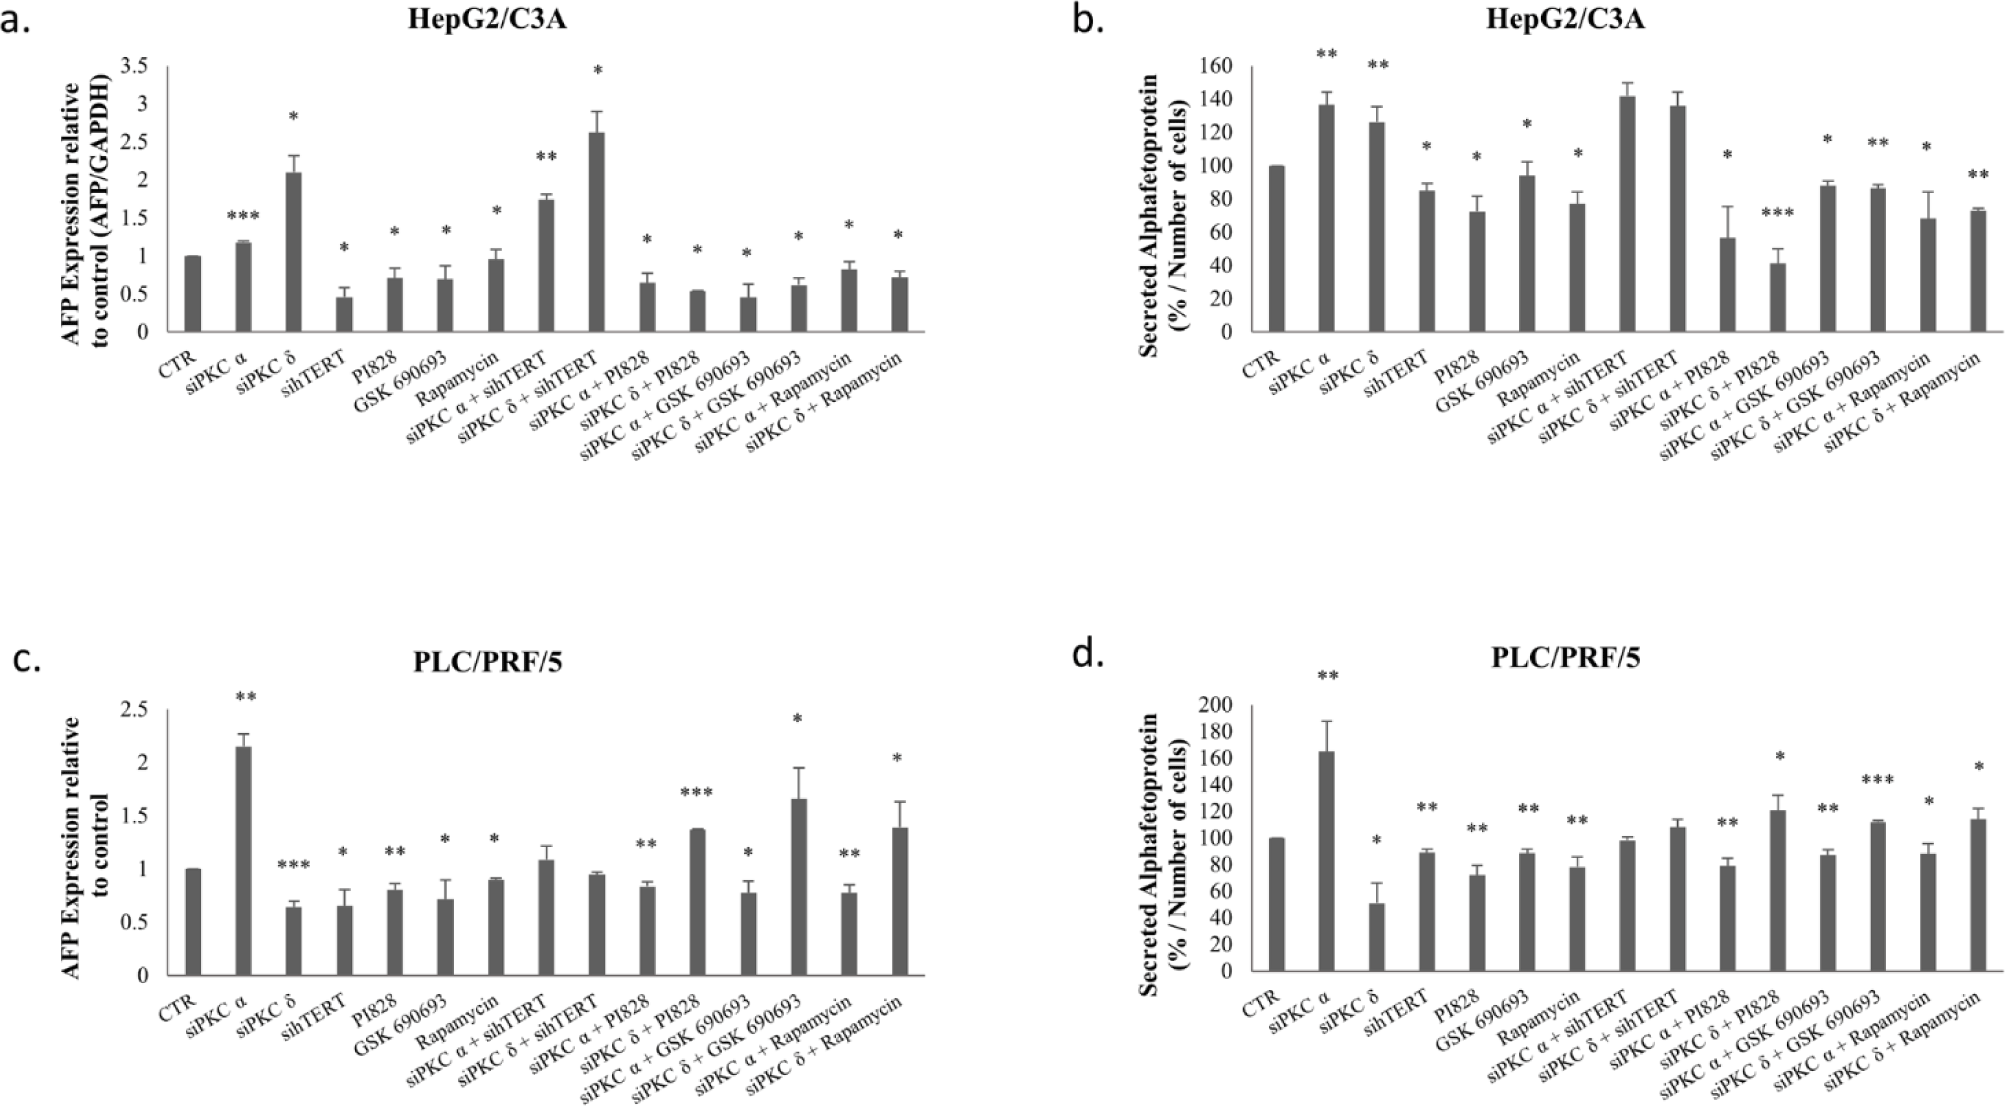
Figure 8 also shows a significant decrease in AFP secretion (p≤0.05) for HepG2/C3A (Fig 8-b) and (p<0.01) for PLC/PRF/5 (Fig 8-d) following these inhibitions.
Interestingly, the combination of PKC isoform knockdown using PI3K/AKT pathway inhibitors significantly abolishes AFP upregulation by PKCα and PKCδ siRNAs in HepG2/C3A cells (Figs 8-a-b). Whereas, in PLC/PRF/5, a combined treatment using PKCα and PI3K/AKT/mTOR inhibitors, significantly abrogates AFP upregulation, while it significantly potentiate the effect with PKCδ (Figs 8-c-d). This led us to evaluate the reason behind this enhancement.
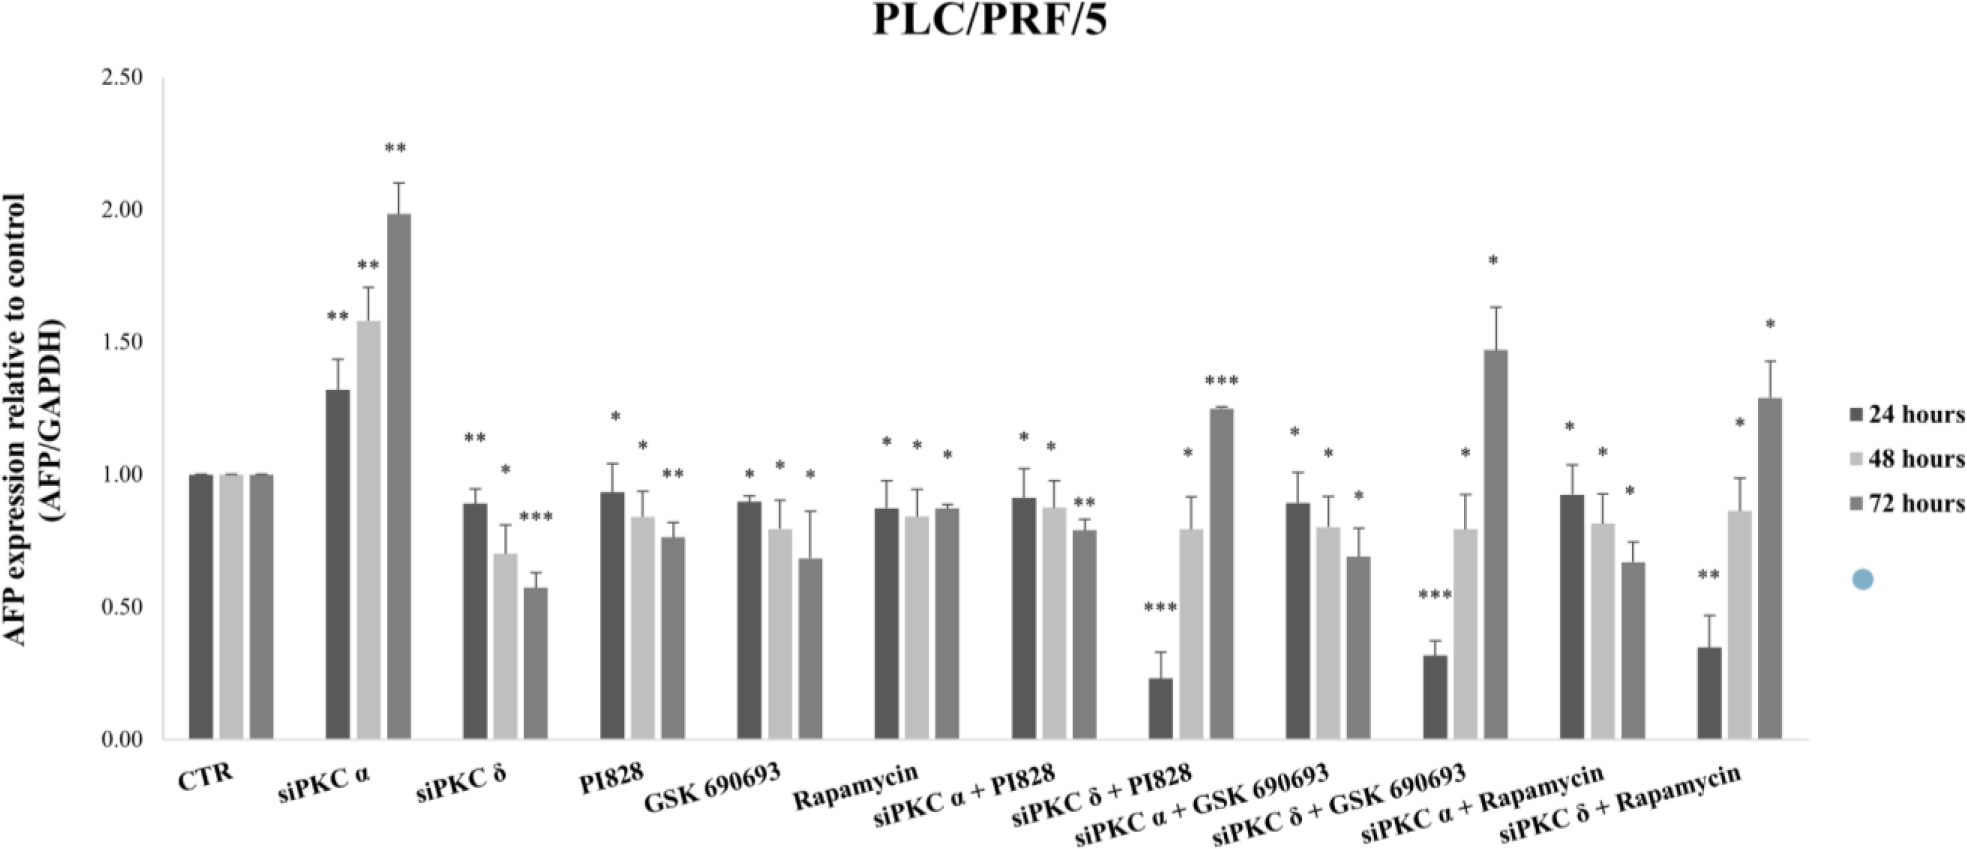
Therefore we evaluated the effect of this combinatory treatment after 24 and 48 hours in PLC/PRF/5. The results showed a highly significant reduction in the expression level of AFP during the first 24 hours of treatment with siPKCδ and PI3K inhibitors (77% (p = 0.001)), AKT (68% (p = 0.0004)) and mTOR (65% (p = 0.0022). However, after 48 hours of treatment, we note that the expression level of AFP began to increase until reaching 79% (p = 0.049) for siPKC δ + PI828, 80% (p = 0.044) for siPKC δ + GSK 690693 and 86% (p = 0.032) for siPKC δ + Rapamycin, and continues to increase after 72 hours to reach 125% (p = 0.0004), 147% (p = 0.0166) and 129% (p = 0.049) for siPKC δ + PI828, siPKC δ + GSK 690693 and siPKC δ + Rapamycin respectively (Fig 9).
On the other hand, Figure 8 showed that a combined inhibition of hTERT, PKCα and PKCδ by siRNAs enhances AFP expression and secretion in HepG2/C3A cells (Figs 8-a-b), but had no significant effect on AFP expression in PLC/PRF/5 cells (Figs 8-c-d). The reason that led us to investigate the effect of the siPKCα, siPKCδ with sihTERT in the first 24 and 48 hours in HepG2/C3A cells. No significant effect was observed on the expression level of AFP after 24 and 48 hours of combinatory treatment.
In order to confirm the implication of PI3K/AKT/mTOR signaling pathway, we further evaluated the effect of PKCα and PKCδ knockdown on PI3K, AKT, and mTOR levels. As shown in Figure 10, the inhibition of PKC isoforms significantly increased PI3K, AKT, and mTOR expressions in HepG2/C3A cells (Fig 10-a). In PLC/PRF/5 cells, PKCα knockdown had the same effect as in HepG2/C3A, however, PKCδ knockdown decreased the expression level of PI3K, AKT, and mTOR (Fig 10-b).

Because we observed that PKCα and PKCδ knockdown modified the expression and activity levels of hTERT in HepG2/C3A and in PLC/PRF/5 cell, we investigated whether the PI3K/AKT signaling pathway might be involved in this mechanism of action. As shown in Figure 11, inhibition of PI3K, AKT, and mTOR, significantly decreased hTERT mRNA levels in the two cell lines (p=0.037, p=0.0006 and p=0.0334 respectively for HepG2/C3A and p<0.01 for PLC/PRF/5).

Moreover, the combined inhibition of PKCα and PKCδ using PI3K and AKT inhibitors abrogates the upregulation of hTERT by PKCα and PKCδ siRNAs in HepG2/C3A cells with siPKCα and siPKCδ for PI828 (p = 0.0268 and p = 0.05 respectively) and for GSK-690693 (p = 0.0083 and p = 0.0196 respectively) (Fig 11-a). Similarly, in PLC/PRF/5 cells, the knockdown of PKCα in the presence of PI828 and GSK-690693 significantly inhibits the stimulation of expression of hTERT (p=0.0001 and p=0.0055 respectively). Therefore the combinatorial treatment of siPKCδ with PI3K and AKT inhibitors significantly abrogates the downregulation of hTERT (p = 0.0454 and p = 0.0.05 respectively) (Fig 11-b).
Moreover, the combined inhibition of PKC isoforms andmTOR had no significant effect on hTERT expression levels in both cell line (Figs 11-a-b).
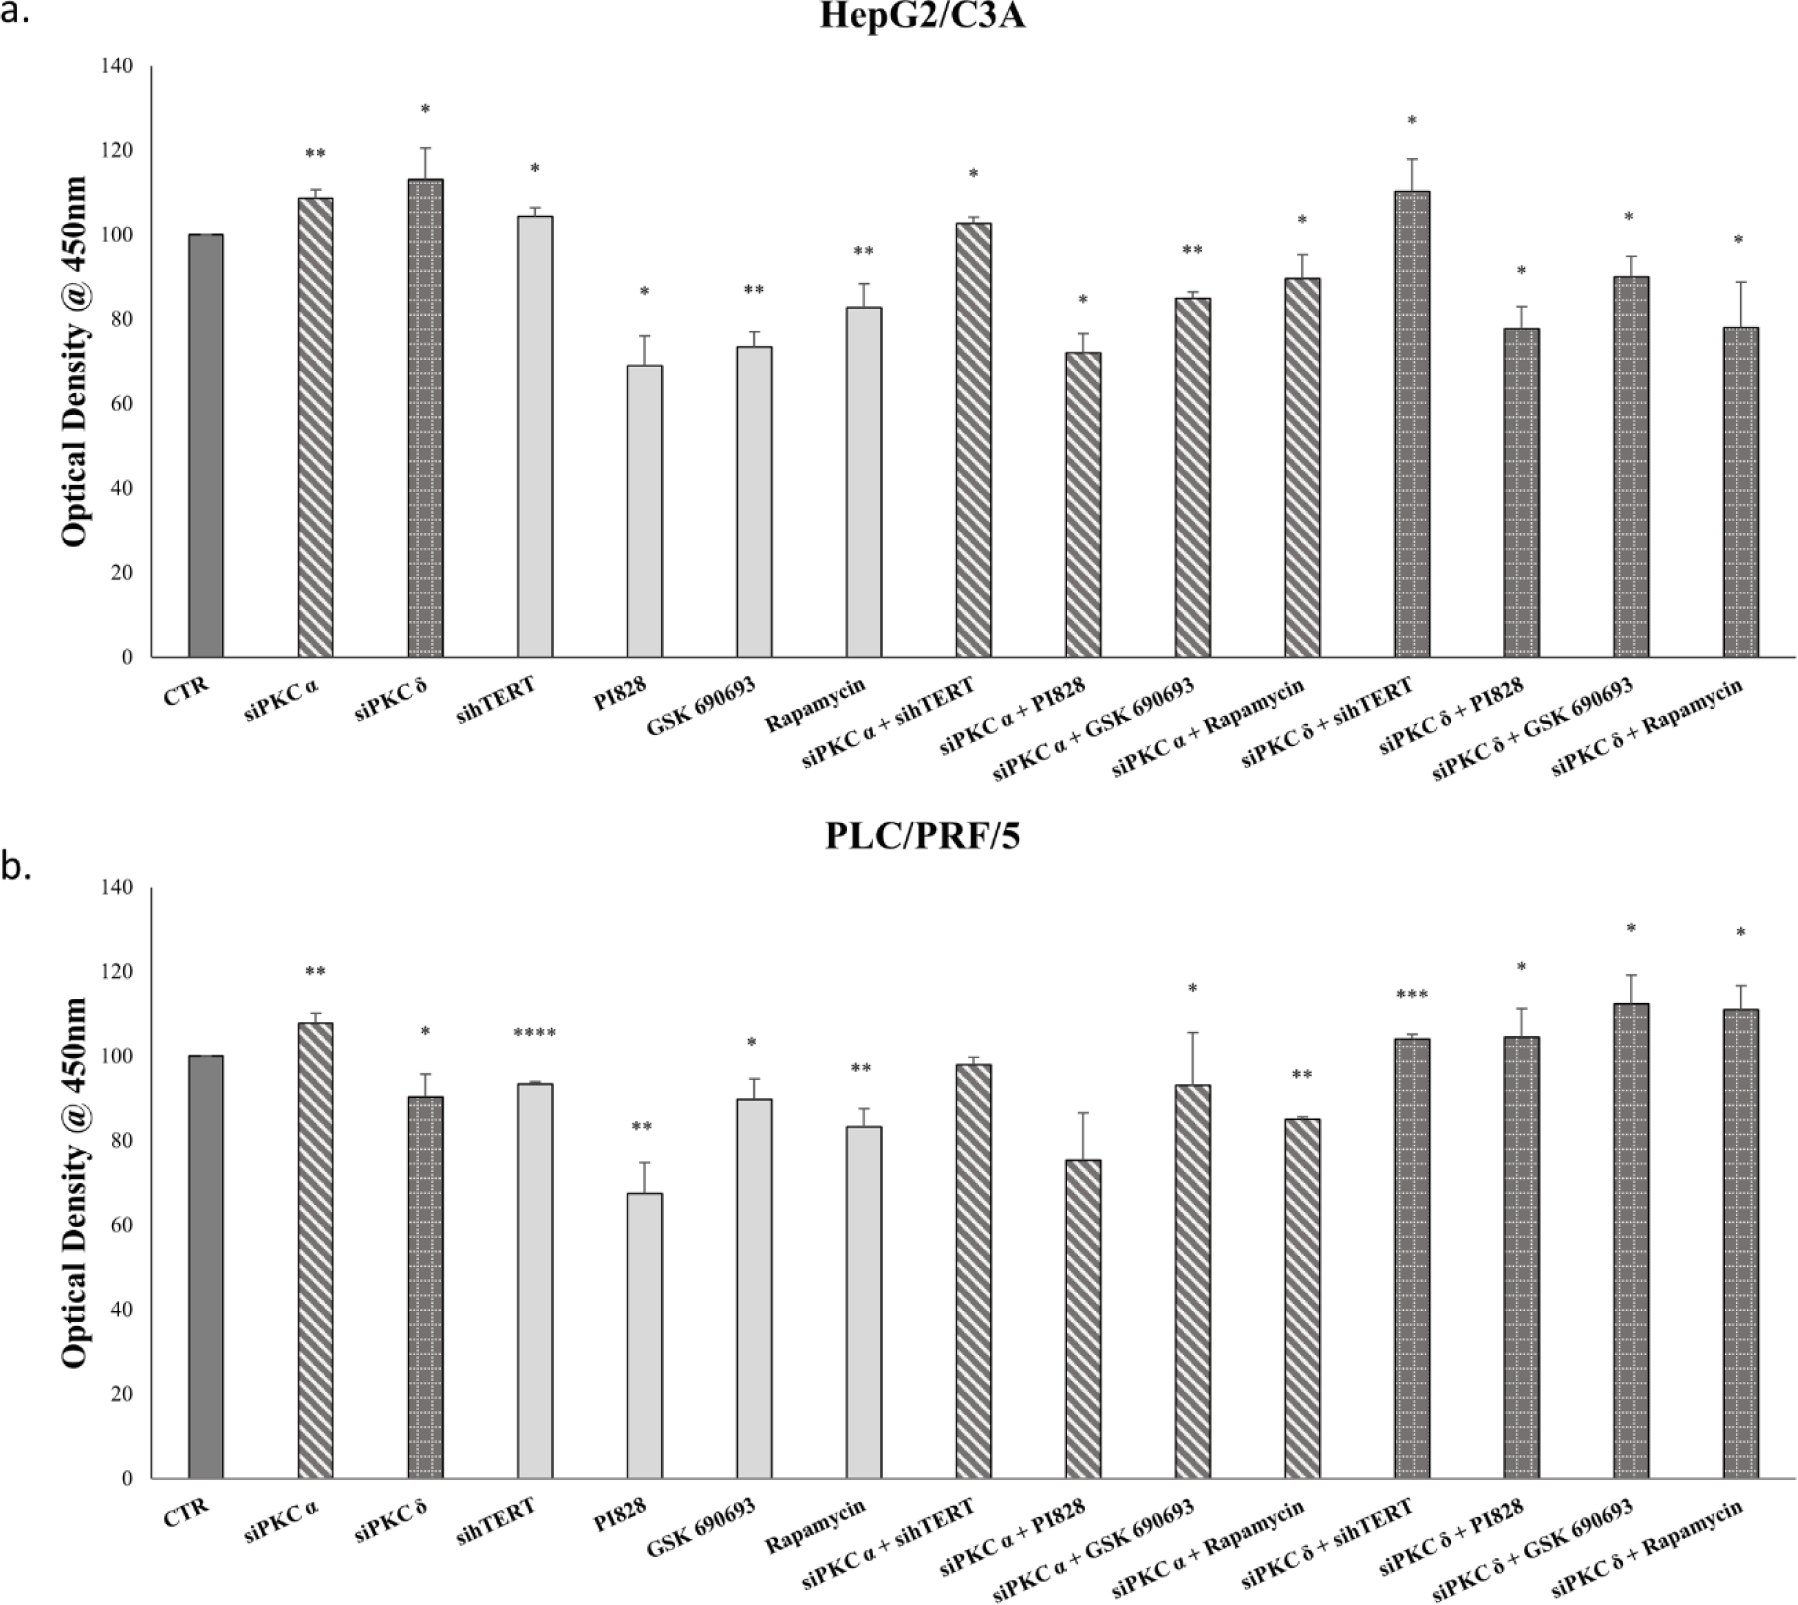
Because the PI3K/AKT pathway is known to be highly implicated in the regulation of cancer cell proliferation, and considering that our results suggest that this pathway might be implicated in the relationship among PKC isoforms, hTERT, and AFP, we studied the effect of PKCα and PKCδ, hTERT, PI3K, AKT, and mTOR inhibition on HepG2/C3A and PLC/PRF/5 proliferation.
Our results showed that PKCα knockdown increased the proliferation of both cell lines (p<0.01) (Figs 12-a-b); however, PKCδ knockdown increased the proliferation of HepG2/C3A cells (p=0.041) (Fig 9a), and decreased PLC/PRF/5s’ proliferation (p=0.0372) (Fig 12-b). Moreover, the inhibition of hTERT, PI3K, AKT, and mTOR significantly decreased cell proliferation (Figs 12-a-b); however, the combined knockdown of PKC isoforms and inhibition of the PI3K/AKT pathway, annulled any increase in the proliferation rate of HepG2/C3A cells induced by the knockdown of PKCα and PKCδ alone and had the same effect for PLC/PRF/5 with siRNA of PKCα; but PKCδ knockdown combined with PI3K/AKT signaling pathway inhibitors, significantly enhanced PLC/PRF/5 proliferation (Fig 12).
4. DISCUSSION
HCC is one of the most common of all cancers worldwide and is known in many countries to have high mortality and incidence rates. Previous studies have shown a possible relationship between the progression, invasion, metastasis, and proliferation of HCC with AFP [38]. AFP is considered not only to be a marker of a greater pathological grade, TNM stage, and larger tumors [9,39], but to be a possible target in the treatment of HCC patients [40]; however, the pathophysiological and biological roles of AFP, that are associated with the high mortality and occurrence rates of HCC are still being studied [41].
Several Studies have explored the role of AFP in the prediction of treatment outcome and clinical follow-up; a strong positive correlation between the concentration of AFP in the Serum of a patient and the aggressiveness of HCC has been found [42-44]. Moreover, Zhou et al., have shown that when using a standard AFP level of 400 μg/l, the expression of hTERT in the AFP positive HCC tissues was significantly higher than the one in AFP negative HCC tissues [45]. These studies, alongside with the fact that cell immortalization is controlled in more than 85% of cancers by the telomerase, the enzyme linked to the development, occurrence, and prognosis of HCC [46], had led a team in our laboratories to investigate a possible interaction between AFP and telomerase in HCC. The inhibition of hTERT, the catalytic subunit of this enzyme, decreased AFP expression and secretion in HCC; however, the signaling pathway through which the latter effect was expressed was not clear [47].
Li et al. [48] have shown that PKC mediates the phosphorylation of hTERT and produces a marked increase in telomerase activity. On the other hand, PKC inhibitors induce a significant decrease in telomerase activity in the treated cells[49]. Within the cell, PKC isoforms mediate several functions, such as proliferation, apoptosis, gene expression, and regulation of the mitogenesis cell cycle [50]. Several studies have assessed the expression of PKC isoforms and their roles in the progression and development of HCC. A study by Tsai et al. has demonstrated that the development of human liver cancer might be related to a decrease [34]. The ultimate aim of our study was to investigate a possible relationship among AFP, telomerase, and PKC isoforms in HCC cell lines and whether the communication among them involves the PI3K/AKT signaling pathway.
We first identified PKC isoforms in three HCC cell lines— HepG2/C3A, PLC/PRF/5 and SNU-387—and the ovarian cancer cell line SK-OV-3 used as a control in our study. In agreement with other studies [51,52], our results showed that PKCα, PKCδ, and PKCɛ isoforms were highly expressed in the four cell lines, especially PKCα and PKCδ in the AFP-producing cell lines HepG2/C3A and PLC/PRF/5. Moreover, PKCδ was even more expressed in HepG2/C3A. PKCβI was slightly expressed in the four cell lines but was found more pronounced in the AFP-producing cell lines; therefore, we suggest that the higher the expression of AFP, the higher the expression of PKCα, PKCδ, and PKCβI. Because PKCβII was only slightly expressed in the PLC/PRF/5 cells, we suggest that HBV infection might influence those expressions, especially given that PKCβII plays a role in the first phase of oncogenesis [50]. We also observed that PKCβII was more expressed in the hTERT- and AFP-negative cell line SK-OV-3. After analyzing the different profiles of each cell line, we found that PKCγ was slightly expressed in the PLC/PRF/5 cell line independent of the expression of AFP and hTERT.
A limited number of studies have examined the effect of AFP expression on PKC isoform expression in HCC cell lines. Interestingly, we observed that AFP overexpression in AFP-negative cells SNU-387 (hTERT +) and SKOV-3 (hTERT -) increased the expression of PKCα, PKCβI, and PKCδ. According to Li et al., AFP colocalizes and interacts in the cytoplasm, with retinoic acid receptors β, and play a role in inhibiting the translocation of the receptors into the nucleus by competitively binding to RAR-β with ATRA[10]. Accordingly, treatment with ATRA inhibited AFP expression and thus significantly decreased the expression of the three isoforms in the HepG2/C3A cells; however, in PLC/PRF/5, PKCα and PKCβI expressions decreased, while PKCδ expression significantly increased. This difference might be correlated with the grade of both HCC and HBV infection. In fact, Lu et al have suggested that HBV infection might influence the expression of PKCβ isoform in HCC in the early stages of oncogenesis [51].
Most research has focused on the regulation of telomerase activity and hTERT expression by the PKC isoforms[25]. Our preliminary results showed that SKOV-3, an AFP- and hTERT-negative cell line, expresses PKCβII more highly than the other studied cell lines. These results, together with a lack of studies in this area, prompted us to investigate the effect of the presence or absence of hTERT on the expression of PKCβII. Following inhibition of hTERT by siRNA in SNU-387, an AFP-negative cell line, and in HepG2/C3A, an AFP highly secretory cell line, PKC βII expression levels significantly increased in both cell lines. Moreover, we observed that the overexpression of hTERT significantly decreased the expression of PKCβII in HepG2/C3A and in SNU-387 cells. Hence, PKCβII is regulated by hTERT expression independent of AFP expression.
Furthermore, we examined whether the presence of AFP affects PKCβII expression in the same manner by which it affected the other isoforms. By inhibiting AFP with ATRA in the HepG2/C3A cells and overexpressing it in SKOV-3 cells, PKCβII expression decreased and increased, respectively. Hence, we demonstrated that PKCβII is independently regulated by both hTERT and AFP expression.
As mentioned, AFP correlates with the truculence of HCC, and studies have suggested a relationship among tumor size, degree of etiology, and differentiation with AFP serum levels[53]. Taking these observations together with the knowledge that PKC isoforms are responsible for cell proliferation, regulation of mitogenesis, and other functions in several cancer types, we investigated the possible relationship between the most expressed PKC isoforms and AFP expression and secretion in the HCC AFP-positive cell lines used in this study. We observed some unexpected results. In the HepG2/C3A cells, the knockdown of PKCα, PKCβ, PKCδ, PCKε, and PKCγ by siRNAs increased AFP expression and secretion. The same pattern was observed in PLC/PRF/5 cells, except that PKCδ siRNA had the opposite effect on AFP expression and secretion. We suggest that this might be the result of the unique and, at times, opposing roles of PKC isoforms in both the normal and diseased states[54]. In fact, even the same isoform within the same cell can play contrasting roles depending on the stimuli[55]; therefore, we studied the effect of Go6983, a pan-PKC inhibitor, against PKCα, PKCβ, PKCγ, and PKCδ, as well as the effect of a pool of siRNAs (PKCα, PKCβ, PKCδ, PKCε, and PKCγ) on AFP expression and secretion. We found that a wide-range inhibition of PKC isozymes decreased AFP expression and secretion in both HepG2/C3A and PLC/PRF/5 cells.
Further investigation showed that PKC isoforms regulated hTERT expression. Indeed, a number of studies have reported that PKC is involved in the regulation of telomerase activity coincident with the expression of hTERT in the treated cells[49]. The present study demonstrates the gene-silencing effect of PKCα, PKCβ, PKCδ, PKCɛ, and PKCγ on the regulation of hTERT expression. Our results showed an increase in hTERT expression in the HepG2/C3A cell line, and the same pattern was observed in the transfected PLC/PRF/5 cell line; however, silencing PKCδ decreased hTERT expression. Both Go6983 and the siRNA pool of PKC isoforms decreased hTERT expression in the two studied cell lines; therefore, separately inhibiting each isoform mostly enhanced AFP and hTERT expressions, while inhibiting several isoforms together repressed AFP and hTERT expression.
Because the two most expressed isoforms in HepG2/C3A and PLC/PRF/5 cells—PKCα and PKCδ—have different effects on AFP and hTERT expression, and because several studies have shown that these isoforms can promote or suppress tumors and play different roles in tumor growth and proliferation [56], we were impelled to further investigate their roles in regulating telomerase activity in HCC cells. The inhibition of their expressions increased telomerase activity in HepG2/C3A cells, and PKCα siRNA increased telomerase activity in PLC/PRF/5 cells, while PKCδ decreased it concurrent with hTERT expression. Taken together, our results suggest that AFP expression and secretion, as well as telomerase expression and activity, are distinctively modulated by PKC isoform expression, and show for the first time a possible relationship of PKC isoforms to both AFP and hTERT in HCC.
Several growth factors rouse cell growth and proliferation are induced by receptors and ligands to activate the PI3K/AKT pathway in different types of cancer [57]. PI3K/AKT has been shown to be a critical pathway in the development of liver carcinogenesis and for HCC cell survival and growth. As mentioned, PKC isoforms are implicated in many cellular processes, and their regulation is linked with the prognosis and progression of HCC [29]. Several reports have shown that PKCα plays a crucial role in cell proliferation, differentiation and survival [27]. Upstream modulators of PI3K pathway, like scaffolding proteins, and growth factor receptors can be deactivated by PKCα [58]; however, it can also directly inhibit PI3K activity [59]. Moreover, PKCδ also plays opposite roles in regulating the PI3K/AKT pathway. It can both endorse apoptosis by interfering with Akt [60], and intervene in an anti-apoptotic signaling cascade via PI3K mediated survival pathway [61]. In our study, we investigated whether the relationship between PKCα, PKCδ and AFP is involved in the PI3K/AKT signaling pathway or hTERT regulations.
Intriguingly, we observed that PKCα and PKCδ siRNAs increased the expression of PI3K, AKT, and mTOR in the HepG2/C3A cells. The same pattern was observed in PLC/PRF/5 cells; however, the inhibition of PKCδ decreased PI3K, AKT, and mTOR expression. Thus, PKCα and PKCδ regulate the expression of the PI3K/AKT pathway in the HCC cell lines, but specifically in the HepG2/C3A and PLC/PRF/5 cells.
We further investigated the effect of the inhibition of PKC isoforms on AFP expression and secretion by combining siRNAs with PI3K, AKT, and mTOR inhibitors. We first demonstrated that the effect of each individual inhibitor decreased AFP expression and secretion, and then observed that in the HepG2/C3A cells, treatment with both PKCα and PKCδ siRNAs repealed AFP upregulation; however, in PLC/PRF/5 cells, combined treatment of PKCα and PI3K/AKT/mTOR inhibitors annulled AFP regulation, while the combined treatment of PKCδ significantly decreased AFP expression in the first 24 hours, but because of a retro-control mechanism this expression has enhanced 48 and 72 hours after treatment.
Nevertheless, the effect of the combined treatment of inhibiting hTERT and PKCα and PKCδ using siRNAs had no relevant effect on AFP expression and secretion, except to note that AFP expression and secretion decreased after hTERT gene silencing with siRNAs. Hence, we suggest the regulation of AFP expression by PKCα and PKCδ through the PI3K/AKT pathway.
The results of the current study, as well as those previously conducted in our laboratories, have shown that telomerase is involved in AFP regulation; therefore, it is important to identify the locus of hTERT within the signaling cascade. The inhibition of PI3K, AKT, and mTOR in the two studied HCC cell lines decreased hTERT expression; however, treatment with PI3K and AKT inhibitors combined with PKCα and PKCδ repeals hTERT expression, while mTOR inhibitors combined with PKCα and PKCδ had no effect on hTERT upregulation. Furthermore, HepG2/C3A and PLC/PRF/5 proliferation was correspondingly regulated in proportion to AFP up-or downregulation following the individual and combined treatments with PKCα, PKCδ, and hTERT siRNAs and PI3K, AKT, and mTOR inhibitors.
Conclusion
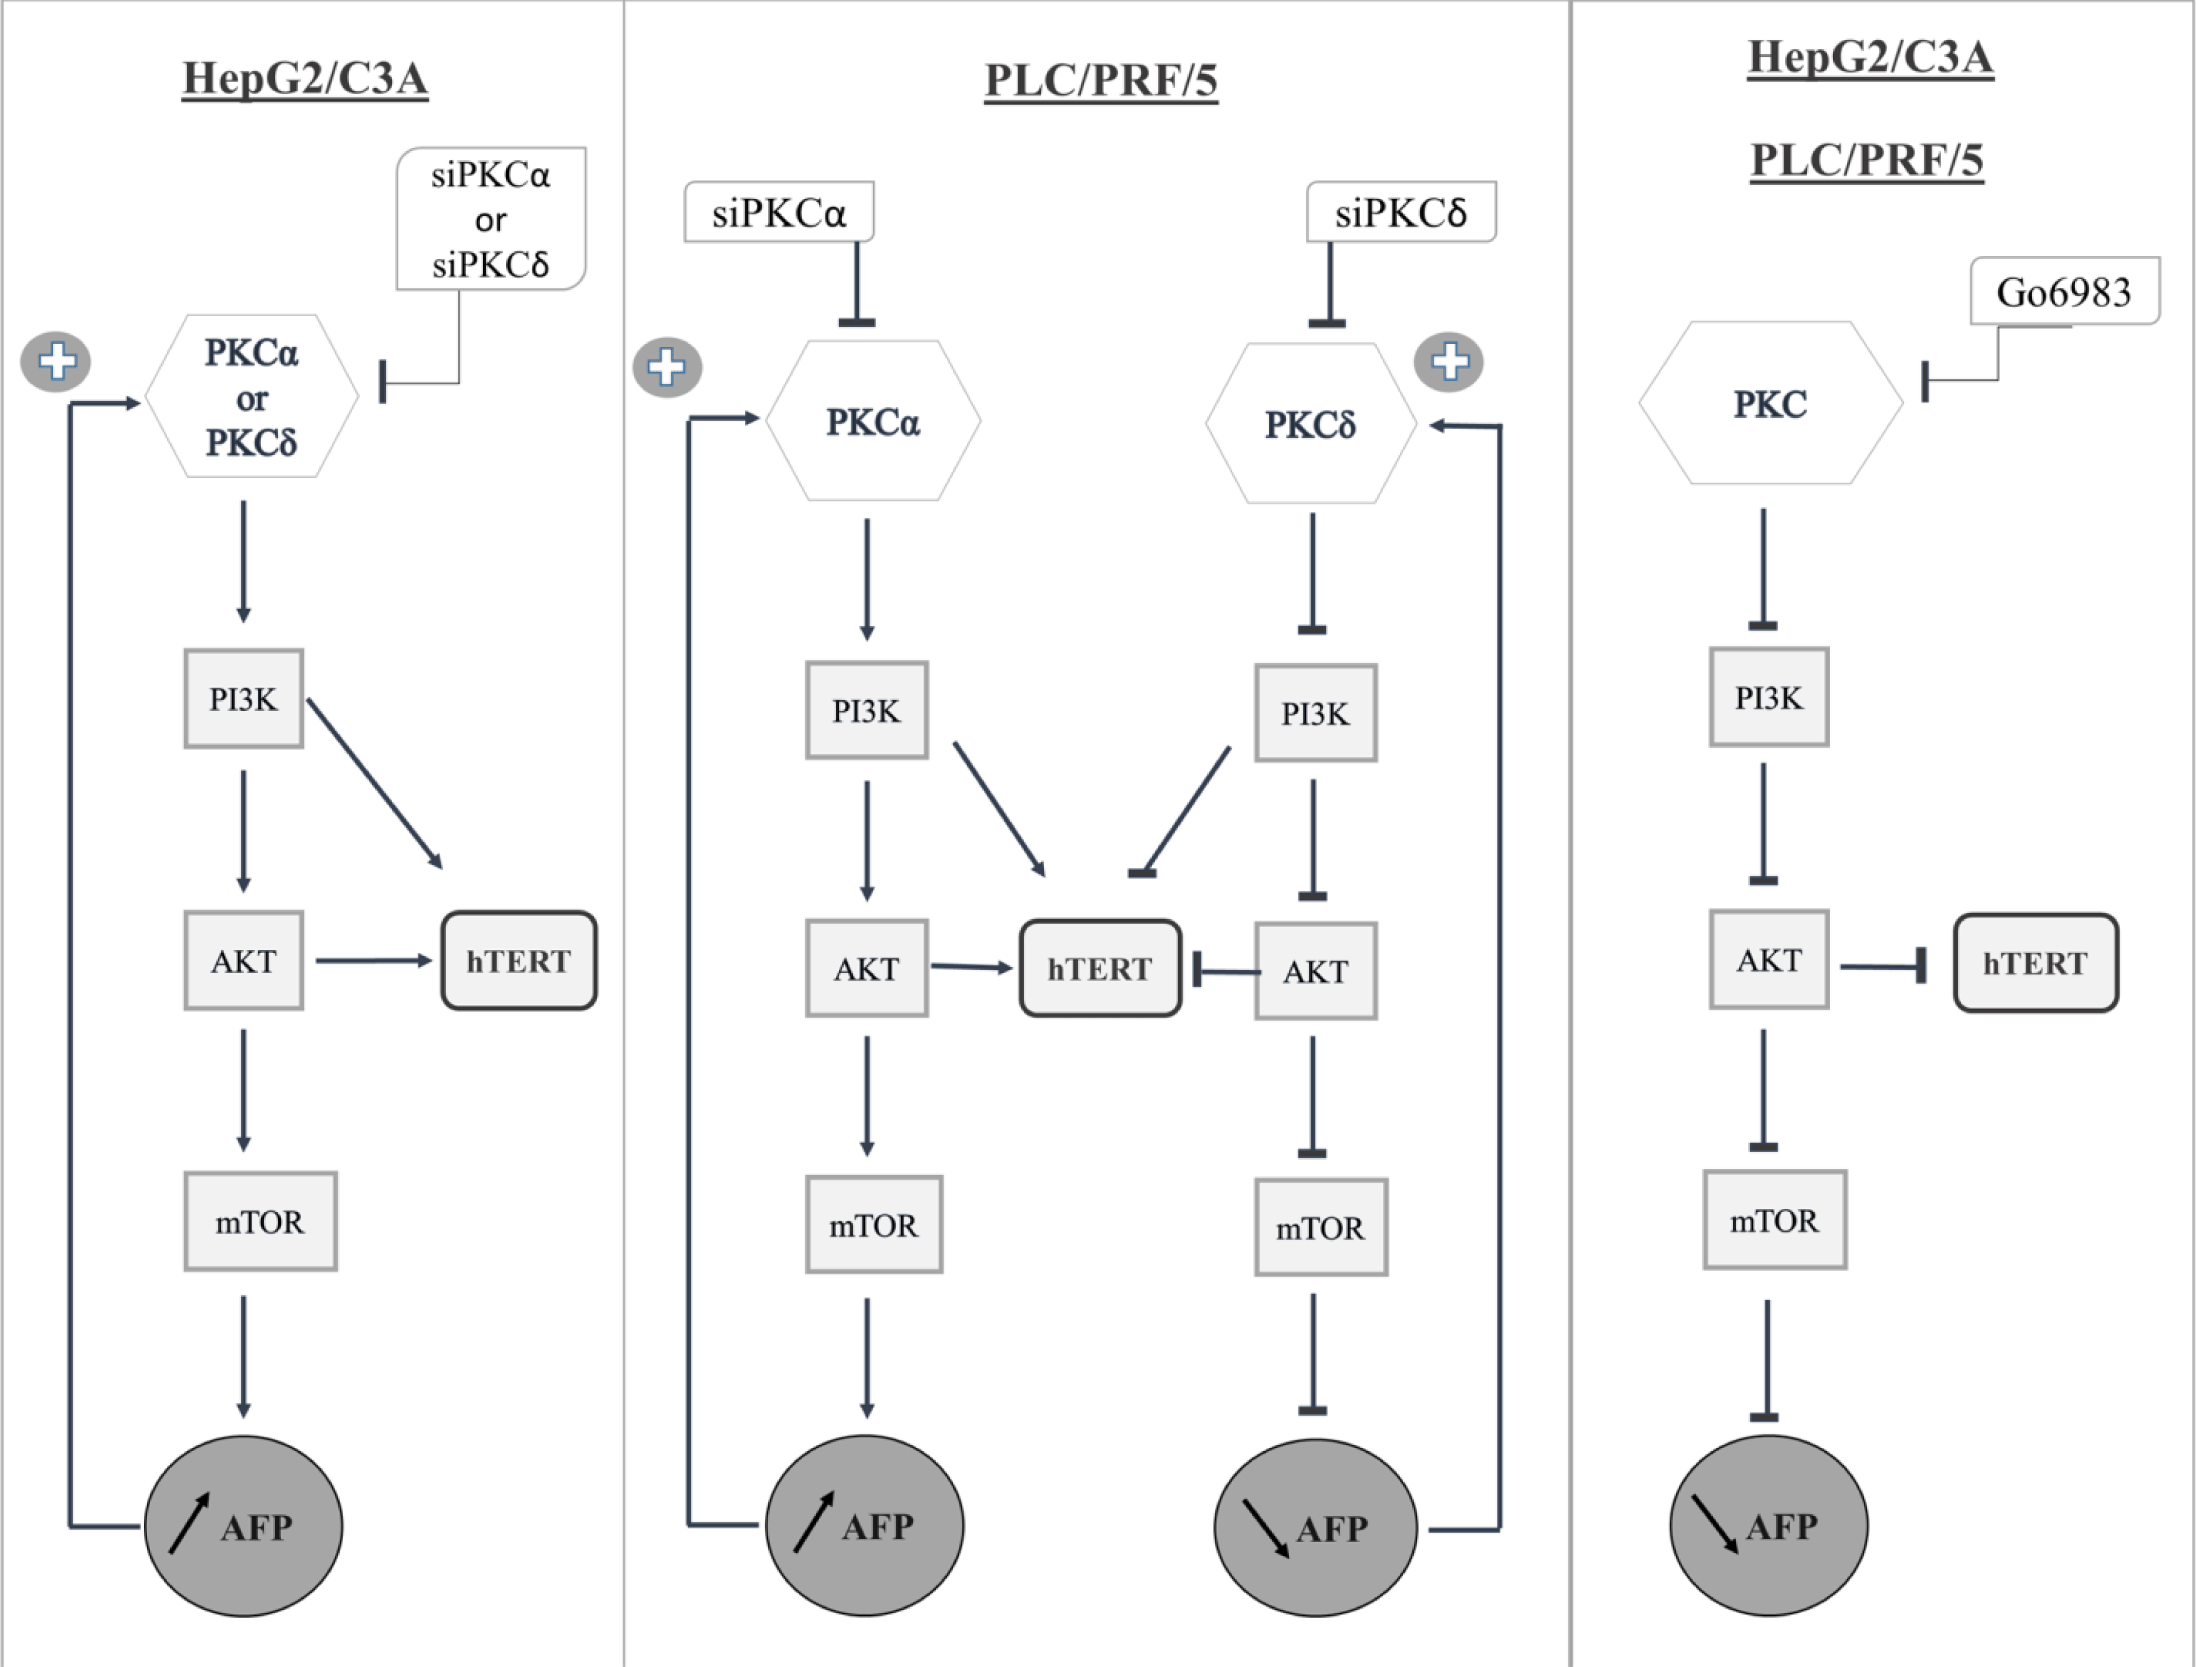
We documented here for the first time the effect of PKC isoforms on AFP expression and secretion and the effect of the presence or absence of AFP and hTERT on the expression of PKC isoforms in different HCC cell lines (S3_Fig).
From our results, we suggest that PKCα and PKCδ inhibit AFP expression and cellular proliferation by blocking the PI3K/AKT/mTOR signaling pathway in HepG2/C3A cells; however, although PKCα exhibits the same pattern in PLC/PRF/5 cells, PKCδ increases both AFP expression and cellular proliferation by activating the PI3K/AKT/mTOR pathway. In addition, hTERT is regulated by PI3K and AKT in both cell lines; consequently, it regulates AFP expression; however, additional studies should be conducted to assess the effect of a wide range of inhibitors on AFP through the PI3K/AKT/mTOR pathway and on cell proliferation, and to confirm the in vitro observations using in vivo experiments.

