1. INTRODUCTION
As the life expectancy of people is constantly growing, lumbar spinal canal stenosis (LSCS) due to degeneration is also increasingly popular with people at the age of 50 - 60, which affects the quality of patient’s life. Main clinical symptoms of LSCS are back pain, numbness, and signs of nerve pain. Patients with LSCS due to degeneration often develop symptoms while walking or bending backward and the pain may relieve when laying down or bending onward. It can be said that while standing, the whole body upright is against Gravity and puts pressure on the spine, which can reveal the stenosis of the spinal canal and cause clinical symptoms [1]. MRI is a non-invasive diagnostic tool that is widely used to assess the spinal canal status for patients with LSCS.
There are several types of research have been done on the correlation of clinical symptoms with the severity of spinal canal stenosis with MRI [2]. However, there are still controversies and have not come to a consensus yet, as there are cases when symptoms are available but no abnormal stenosis is found in MRI and vice versa. In addition, all studies seem to be performed with MRI while patients were in the supine position, which means the spine did not load the whole weight of the body.
Recently, axial-loaded MRI has been widely applied and is said to adequately reveal spinal changes in the same way as standing up posture. Some of the clear differences are the bulging of a spinal disc, thickening of the yellow ligament and morphological changes of the fat around the spinal epidural space, which may result in differences in MRI films [3]. Axial-loaded MRI has been shown that it can demonstrate more accurately the real status of spinal canal stenosis than conventional MRI [10]. It was revealed that if the axial-loaded MRI shows a 15% decrease Dura Cross-sectional Area (DSCA) compared to conventional MRI, the axial-loaded MRI is considered to increase the accuracy of the diagnosis and to influence the decision to manage LSCS [11]. Haruo Kanno et al. investigated the correlation between clinical symptoms and axial-loaded MRI images; then indicated that there was a correlation between DSCAin axialloaded MRI and clinical symptoms such as JOA, VAS for leg pain and walking distance [5]. Currently, in Vietnam, the studies on the correlation of APD and DSCA in conventional MRI and axial-loaded MRI with clinical symptoms are very limited. This study aimed to evaluate the dynamic effect of axial loading on lumbar spinal canal stenosis using MRI in patients with degenerative spinal stenosis. Moreover, in this study, this is the first time we applied a new system that we have recreated from the original loading frame system in order to fit with the demands of Vietnamese people. Results from our study could be evidence for widely applying the new loading frame system in Vietnam.
2. METHOD
For this study, a total of 62 patients diagnosed with LSCS due to degeneration were examined. All subjects had clinical symptoms of neurogenic claudication provoked by either walking or prolonged standing, and symptoms of spinal canal stenosis with Cauda Equina Syndrome (CES). Patients with comorbidity, including osteoporosis or fractured spine, or a spine containing a bone tumor were not included in our study. Patients with sciatica were also excluded from this study.
The Review Board of our Phu Tho General Hospital approved this study. Informed consent was obtained from all patients before their participation in this study.
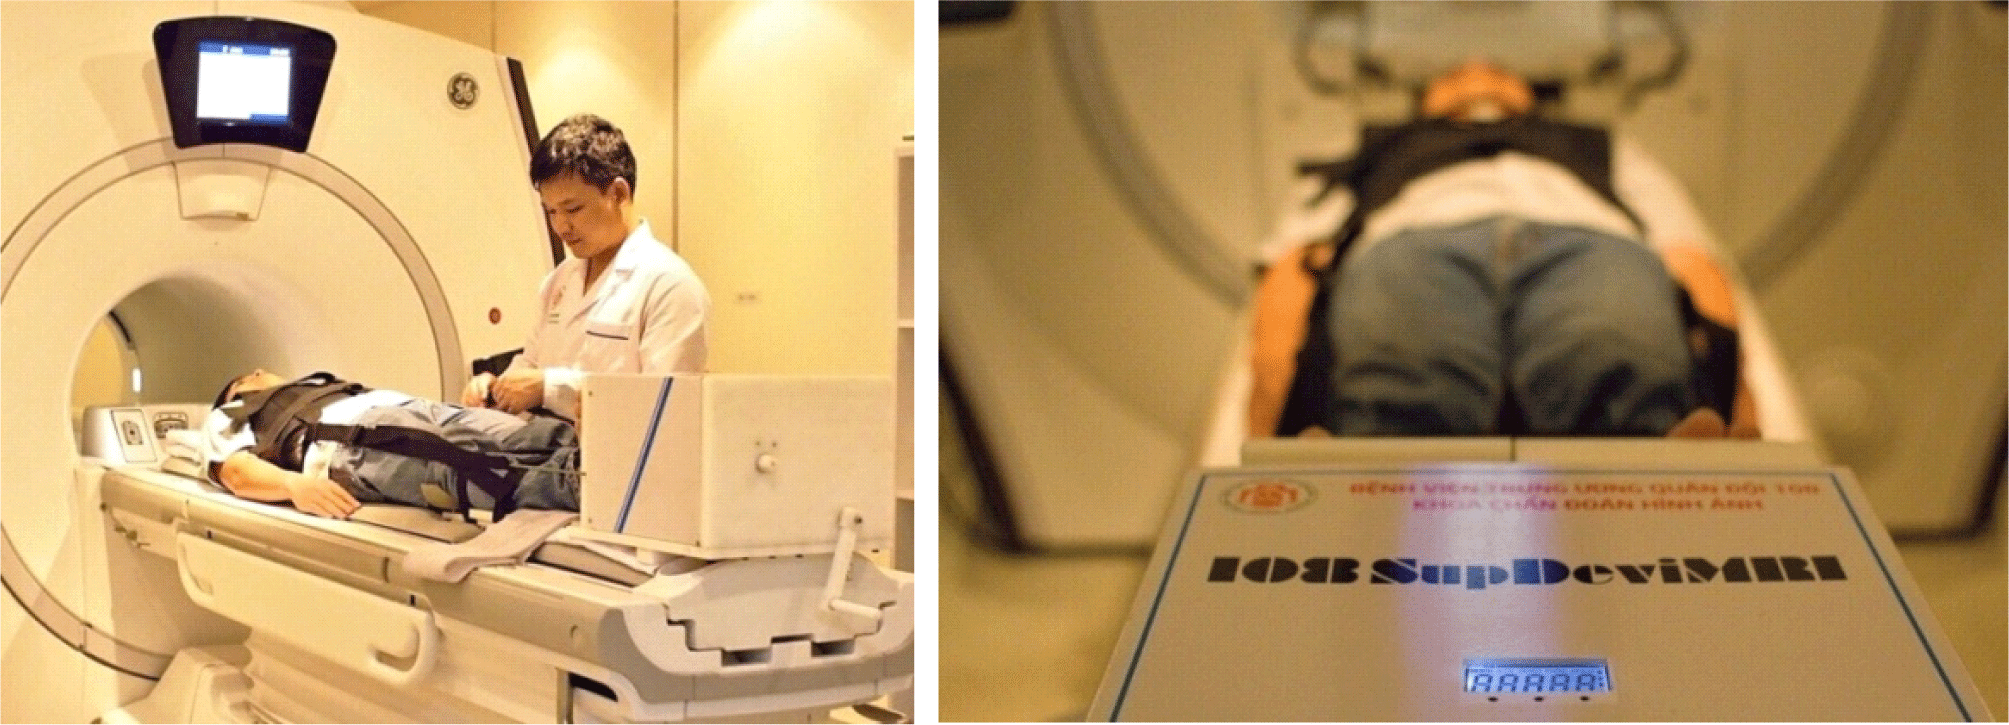
All patients were performed with both conventional MRI and axial-loaded MRI. The MRI scanner was performed on a 1.5 Tesla system (Magnetom Vision, Siemens, Erlangen, Germany) using a lumbar coil with the 4 mm total distance between adjacent slices would be from L2-L3 to L5-S1. Based on the mechanism of compression in loaded MRI designed by DynaWell [3], we have modified the loading frame system to make the compression more similar to the real loading in the vertical axis of the body, in which clinical symptoms appeared. Loading force is transmitted to the pedal system where patients’ feet were placed on and there was horizontal pulley connected to electronic measurement. The loading force was adjusted corresponding to 40-50% of body weight (based on the results of the trial and clinical studies in the world) [5]. All devices were non magnetic (hard plastic materials) to ensure that the quality of MRI films would not be affected.
Patients wore a special vest and were performed MRI as a general indication. After the conventional scan, the patients were asked to stay still for 5 minutes and the axial-loaded MRI was performed. During the scanning, the knees were kept in a straight position to simulate standing posture. A pillow was placed under the patient’s lumbar spine to prevent bending position during axial-loaded MRI scanning procedures. Simultaneously, pain scales were been evaluating and the loading force was increased gradually until patients reached severe pain. Then, the compressing process was stopped and the procedures were finished.
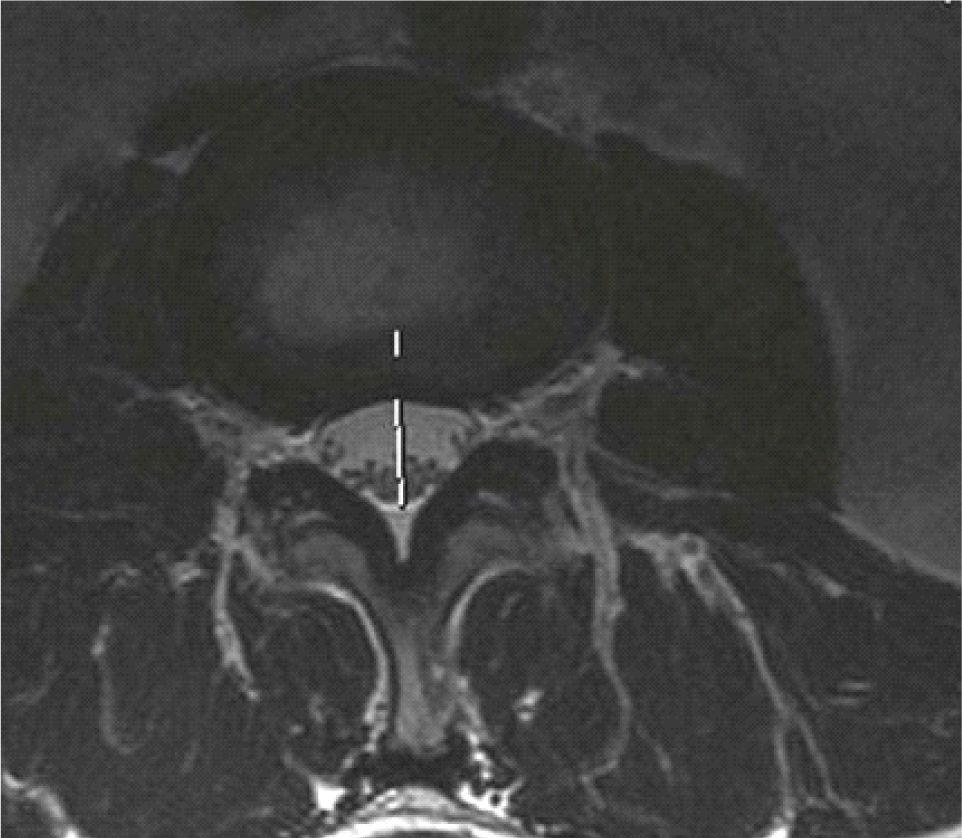
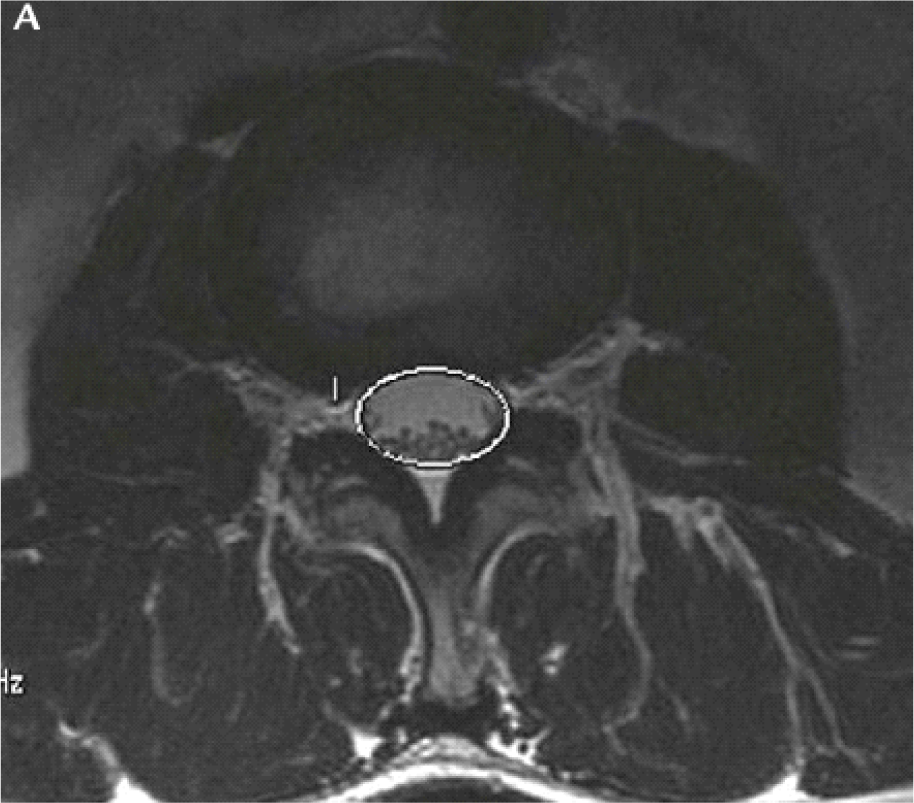
The APD and DCSA were measured using Onis software 2.5.
-
- APD of the spinal canal was the diameter of the anterior-posterior of the cross-sectional of the disc on MRI films, which was used to determine stenosis severity of the canal [7].
APD: :: 10 mm: Severe stenosis
APD: 10 - 12 mm: Moderate stenosis
APD > 12 mm: Normal
-
- The spinal area is the area which is surrounded by the dural on the cross-sectional slice on the disc, which is used to access HOS [6].
DCSA <76 mm2: Severe stenosis
DCSA: 76 mm2 - 100 mm2: Moderate stenosis
DCSA > 100 mm2: Normal
-
+ Evaluation criteria:
-
• Evaluating differences of APD in MRI and axial- loaded MRI
-
• Evaluate differences of DCSA in MRI and axial- loaded MRI
-
• Assess the correlation of APD, DCSA of the narrowest part of the spine in MRI and axial-loaded MRI with the differences in duration of symptoms, walking distance, VAS for back pain, VAS for leg pain, ODI and JOA.
-
Pearson correlation coefficients (rs) of the APD and DCSA with baseline characteristics and the severity of symptoms such as duration of symptoms, walking distance, VAS of leg/numbness, and the JOA score (29 scores) were analyzed. The analyses were performed for the APD and DCSA in the conventional MRI and the axial loaded MRI, respectively. In addition, the same analyses were performed for the change in the APD and DCSA.
To examine the clinical significance of the change in the APD and DCSA, the patients were divided into different groups based on JOA and ODI.
Walking distance according to JOA (walking distance less than 100m, from 100 to 500m, from 500 to 1000m, and more than 1000m)
Spinal functional status was assessed by means of the ODI (Oswestry Disability Index): few functions lost: ODI 0-20%; some functions lost, ODI 21-40%; several of functions lost, ODI 41-60%; many functions lost, ODI 61-80%; and all functions lost, ODI> 80%.
Then the baseline characteristics and the severity of symptoms were statistically compared between these groups.
All statistical analyses were performed using the SPSS software program, version 22.0. Data are tested for deviation from the normal distribution within the groups using a Shapiro-Wilks test. Mean and standard deviation (SD) were calculated for normally distributed variables. The differences between groups were tested for statistical significance using the two-sample t test. P < 0.05 was considered statistically significant. Pearson correlation coefficient value greater than 0.40 was considered as satisfactory (rs = 0.81-1.0 as excellent, 0.61-0.80 as very good, 0.41-0.60 as good, 0.21-0.40 as fair, and 0-0.20 as poor) [5].
3. RESULTS
The baseline characteristics and clinical symptoms of all patients were summarized in Table 1. The patients comprised 25 men and 37 women with a mean age of 58 (range, 32-81). The mean duration of symptoms was 23.39 months (range, 3-40 months). According to ODI scores, patient symptoms and disability ranged from a minimal score of 43 to a maximal score of 92. The mean value amounted to 69.23% ± 5.52%, in which patients with ODI in grade 4 accounted for 96.8%. There was no patient at level 1 and level 2.
| Symptoms | Mean±SD |
|---|---|
| VAS of back pain (mm) | 6.00±1.04 |
| VAS of leg pain (mm) | 6.64±1.33 |
| ODI score (points) | 69.23± 5.52 |
| JOA score (points) | 10.03±1.35 |
| Walking distance (m) | 0.48±0.47 |
The values of the APD in conventional MRI and axial loaded MRI for each patient were shown in Table 2. In all the patients, the average APD in the conventional and axial loaded MRI were 6.39±1.25 mm, and 5.67±1.22 mm, respectively. The average change in the APD was 0.72±1.02 mm. Similarly, we also found the DCSA in the conventional MRI was change to another level in the axial loaded MRI. The average APD of all the patients in the conventional and axial loaded MRI were 56.74±15.11 mm2, and 56.74±15.11 mm2, respectively. The average change in the APD was 14.09±0.67 mm2.
| Spinal Canal Size | MRI | Axial-loaded MRI | Difference |
|---|---|---|---|
| APD (m) | 6.39±1.25 | 5.67±1.22 | 0.72±1.02 |
| DCSA (mm2) | 56.74±15.11 | 42.64±14.43 | 14.09±0.67 |
Pearson correlation of the APD and DCSA with the severity of symptoms were summarized in Table 3 and Table 4.
The APD in axial loaded MRI had significant and very good correlations with VAS for back pain (rs = 0.83; p<0.01), VAS for leg pain (rs = 0.69; p<0.01), JOA score (rs = 0.70; p<0.01), and good correlation with walking distance (rs = 0.40, p<0.01). Overall, there were no significant correlations of the change in APD between the conventional and the axial loaded MRI.
The DCSA in axial loaded MRI had significant and very good correlations with VAS for back pain (rs = 0.79; p<0.01), VAS for leg pain (rs = 0.57; p<0.01), JOA score (rs = 0.65; p<0.01), and good correlation with walking distance (rs = 0.43, p<0.01). There were significant and good correlations of the change in DCSA with VAS for back pair (rs = 0.73, p<0.01), VAS for leg pain (rs = 0.62, p<0.01), and JOA score (rs = 0.52, p<0.01).
4. DISCUSSION
Previous studies, such as the study of Willen and Danielson has demonstrated that spinal canal stenosis could not be found by existing methods in which, an MRI is taken in bended posture of lumbar without axial loading implementation. Hiwatashi et al. also reported that there was a change of treatment direction by laminectomy after axial loading in patients who were intended to take a conservative treatment before the axial loading [5].
In our study, a total of 62 patients were included, with more women than men. The mean age of our patients was 58 with the range of 32 to 81 years. The age group of 50 - 70 accounted for 70%. Similar to most previous studies [4, 5, 9], the high mean age indicates that the patients with congenitally narrow canals may be represented to the general population. There was a slight female preponderance in our study, with 37 out of 62 patients being female. This is in accordance with the previous studies. Due to the characteristic of LSCS caused by chronic degenerative diseases, patients are usually hospitalized at the late stage of disease with an average duration of pain at presentation in our study was about 2 to 3 years. The mean duration in the previous has ranged up to 5 years [2].
This is in accordance with the previous studies which have also noted of the clinical symptoms of patients [4]. It is showed that lumbar spinal canal stenosis is a chronic condition and patients usually tolerate the disease for a long period of time and admit hospital only when previous treatments they have tried do not respond well. So those, at the time of hospitalization, the clinical symptoms are often severe.
In many previous studies, both the APD and DCSA measured in conventional MRI showed a poor correlation with the severity of symptoms [2, 5, 8]. As a result, our study also showed a less correlation than measuring APD and DCSA in axial loaded MRI. It is explained by the fact that patient’s position in the conventional MRI scanning does not show the full load on the lumbar spine. Then, the axial-loaded MRI can simulate the real condition of load on the spine at which clinical symptoms appear. The change in the APD and DCSA caused by axial loading had significant correlations with walking distance, VAS for back pain, VAS for leg pain, and the JOA score. These results demonstrated that the reduction in the space of the spinal canal caused by axial loading significantly worsened the clinical symptoms, more accurately reflecting the status of the patient in the upright position contributes to the severity of the symptoms in patients with LSCS.
MRIs are known to be on the expensive side, which is over affordable to many Vietnamese people. Therefore, based on the mechanism of compression in loaded MRI designed by DynaWell [3], we have modified the loading frame system to make the compression more similar to the real loading in the vertical axis of the body. The effective of this system has been demonstrated by some results from our study, in which the axial-loaded MRI showed a clearer correlation with clinical symptoms compared to conventional MRI.
4. CONCLUSION
Because it is not currently feasible to perform computed tomography or MRI examination with the patient in a standing or walking position that simulates the activity elicits their neurogenic claudication, axial loading MRI seems to be a good alternative for the patient suspected of lumbar spinal stenosis. The future research should be on evaluation of the economic effectiveness of the modified axial loading MRI.


